Changes in Soil Properties: Conclusions
[addw2p name=”changesInSoilProperties”]
This study indicates that soil pH, organic C and total N tended to decrease with time in the oil palm agro-ecosystem. However, the decline in soil pH was slight whereas those related to organic C and total N corresponded to the period where the oil palm biomass was burnt or partially burnt at replanting. The large increases in soil organic C with the current norm of zero burnt replanting technique were favourable in regards to sustainability and land degradation.
There were large positive changes in soil P and exchangeable K, which might be attributed to the applications of higher rates of phosphate rocks and K fertilizer especially from the 1990s following the results of fertilizer response trials. However, excessive build-up of soil nutrients on the highly weathered tropical soils of Ultisols should be avoided due to their generally low nutrient holding capacity, which may increase the risk of pollution. On the other hand, nutrient depletion should also be prevented as they commonly lead to lower production in the long-term. Thus, close monitoring of the changes in soil nutrients in the oil palm estates is essential.
This study shows explicitly that the soil fertility status of the Ultisols under oil palm in Johor was enhanced through sound fertilizer management practices and zero burnt replanting technique.
Changes in Soil Properties: Results and Discussion
[addw2p name=”changesInSoilProperties”]
The changes, Δ, to pH, organic C, total N, total P, Bray-2 P, exchangeable K and exchangeable Mg were discussed from the following aspects:
-
Site: The different sites where sampling was carried out i.e. in IR and PC
-
Depth: Comparison of rates of change in soil nutrients between the two depths i.e. 0 – 15 cm and 15 – 45 cm
-
Initial value: The initial value, x 1
-
Time / period: The soil sampling data were grouped into 3 main periods i.e. 1982 and earlier (coinciding with burning as the main land clearing method), 1983 to 1994 (where partial burning was generally carried out) and post 1994 (where zero burning was the main land clearing method). The lag time for all 3 periods are not the same.
Site, Depth and Initial Value
Table 2 summarizes the sample size for the data used as well as the median initial value of each parameter for both sites (IR and PC) and depths (0 – 15 cm and 15 – 45 cm) while Table 3 summarizes the % change of each parameter.
Table 2 : Sample size and median initial value of each soil chemical property (parameter)
|
Parameter / Variable |
Median of initial value for each parameter at 2 sites and 2 depths |
|||||
|
Site |
Depth |
|||||
|
n* |
IR |
PC |
n* |
0-15 cm |
15-45 cm |
|
|
pH |
472 |
4.48 |
4.26 |
472 |
4.45 |
4.30 |
|
Organic C (%) |
– |
– |
– |
390 |
1.30 |
0.92 |
|
Total N (%) |
– |
– |
– |
390 |
0.120 |
0.090 |
|
Total P (mg/kg) |
320 |
146.5 |
216.0 |
320 |
212.5 |
151.1 |
|
Bray-2 P (mg/kg) |
520 |
11.6 |
35.8 |
520 |
27.7 |
15.5 |
|
Exch. K (cmol/kg) |
538 |
0.140 |
0.240 |
538 |
0.190 |
0.170 |
|
Exch. Mg (cmol/kg) |
478 |
0.200 |
0.220 |
478 |
0.240 |
0.179 |
|
Parameter / Variable
|
Median of % change for each parameter at 2 sites and 2 depths |
|||||
|
Site |
Depth |
|||||
|
IR |
P. Circle |
p-value |
0-15 cm |
15-45 cm |
p-value |
|
|
pH |
-3.20 |
-1.97 |
0.0097 ** |
-2.48 |
-2.60 |
0.0000 ** |
|
Organic C (%) |
– |
– |
– |
-9.69 |
-15.76 |
0.0001 ** |
|
Total N (%) |
– |
– |
– |
-6.72 |
-12.50 |
0.0001 ** |
|
Total P (mg/kg) |
0.8 |
-3.9 |
0.3575 ns |
1.9 |
-4.5 |
0.0000 ** |
|
Bray-2 P (mg/kg) |
16.0 |
-9.5 |
0.0000 ** |
6.7 |
-7.4 |
0.0000 ** |
|
Exch. K (cmol/kg) |
15.3 |
0 |
0.0031 ** |
5.1 |
7.6 |
0.6643 ns |
|
Exch. Mg (cmol/kg) |
-18.5 |
-3.3 |
0.1112 ns |
-5.9 |
-18.6 |
0.0022 ** |
Soil pH
Most crops grow best at a certain range of soil pH as soil acidity affects plant growth in many ways. However, the oil palm is tolerant to high acidity and is able to grow well under a broad range of soil pH (Goh and Chew, 1995a), from 4.0 to 5.5. Hyperacidity symptoms could be observed when soil pH is below 3.5 as the low pH is deleterious to normal root growth and function (Poon, 1983).
In general, there was a slight decline in soil pH of less than 3.2 % for both micro-sites and depths (Table 3). The declines in soil pH might be mainly attributed to nitrification process, which oxidizes NH4 + to NO3– and releasing H+ ions as follows:
![]()
Therefore, N sources from applied fertilizers, organic manure and legumes containing or forming NH4+ increases soil acidity.
The change in soil pH (Table 3) was more pronounced in the IR (pH lower by 3.2%) compared with the PC and this could have been attributed to the higher initial value of pH in the IR (Table 2), which was more susceptible to change due to the sigmoidal pH buffering curve. Moreover, the lower exchangeable bases in the IR (Table 2) would reduce its buffering capacity against the H+ produced from the nitrification process resulting in a larger decline in soil pH.
The lower initial value of pH in the PC (pH = 4.26) could be due to the prolonged concentrated application of N fertilizers in its limited space compared with the IR (Kee et al ., 1995). Most experimental evidence also supports the view that the electrical potential gradient maintained by the H+ efflux pump provides the driving force for active uptake of K+ across the plasma membrane (Haynes, 1990). Therefore, with more rooting activity for K uptake in the PC (Kee et al ., 1995), higher extrusion of H+ would occur resulting in low soil pH. The same would also be expected to occur to Ca2+ and Mg2+ uptake. The NO3– is also leachable to lower depths along with the basic ions of K+, Ca2+ and Mg2+. As these bases were removed and replaced by more H+, soils at lower depths (2nd depth of 15 – 45 cm) became slightly more acidic, which was evident from the results in Table 3.
This acidifying effect has also been reported in established oil palm plantations (Chew and Pushparajah, 1996), whereby fertilizer applications have been carried out as a routine. From our data, the magnitude of decline in pH also appeared to be larger with a longer lag time in sampling (Figures 2a and 2b) i.e. % drop in pH greater when the two samples were taken at longer interval. Kee et al . (1995) working on Musang series soil (Typic Paleudult) showed that the surface soil pH after 7 years of applying fertilizers at the highest rate within a circle of about 2 m radius around the palm base declined markedly to 3.8 compared with control plots of 4.2, a drop of almost 10% compared with the approximately 3% obtained via our data (extrapolated for 7 years from Figure 2b). All in all, the drop in pH although noted, was generally small and probably negligible to the oil palm, which is tolerant to such conditions.

Nevertheless, we should still take necessary measures to prevent soil pH from going lower as it is usually used as a criterion of land degradation. Some measures to minimize the reduction of soil pH include the following:
-
Broadcasting of fertilizers instead of applying them in a band or concentrating them only to the PC
-
Use of ammonium nitrate or urea will have lower acidifying effect. However, urea application should be restricted to clayey soils and properly timed to reduce volatilization losses whereas ammonium nitrate should be avoided in sandy soils due to its higher leaching potential
-
Application of alkaline fertilizers e.g. magnesium carbonate and empty fruit bunches
-
Maintain proper water-table over acid sulphate layers in acid sulphate soils to prevent or reduce the oxidation of sulphite that results in sulphuric acid build-up
Soil Organic Carbon
Managing the soil organic carbon (organic C) would go hand in hand with the management of soil organic matter (SOM) and in oil palm plantations, soil fertility is mainly determined by the management of SOM including soil biological activity, soil nutrient management etc. Soil fertility management on the other hand is a keystone of sustainable agriculture. As the oil palm plantations have many sources of SOM, most of them are produced daily by the living oil palm itself such as pruned fronds, male inflorescences, shed leaf bases and roots as well as palm bio-products of empty fruit bunches (EFB), palm oil mill effluent (POME), decanter sludge, shell and fibre, natural vegetation and legumes, efficient management of SOM and the soil organic C would then ensure soil fertility, hence sustainability (Figure 3).

Soil organic C decreased at both depths (0-15 cm and 15-45 cm) with the lower depth dropping at a greater magnitude of 15.76% (Table 3). Although this decrease in soil organic C was substantial, it was localized and may not represent a decline in organic carbon on an agro-ecosystem basis as exemplified by a simplified oil palm “Carbon Cycle” (Table 4). The carbon supply from the oil palm ecosystem was computed from data of pruned fronds only without considering the following where data are unavailable:
- How much is lost as CO2
- How much is the net return from other palm organic sources e.g. palm bio-products (EFB, POME etc.), male inflorescence, frond buds and root turnover
- How much is the contribution of ground vegetation
Table 4 : Simplified oil palm “Carbon Cycle”
|
Particulars
|
Value |
|||
|
Carbon supply from Palm
|
Dry weight of pruned fronds (t/ha/yr) 1 |
8.5 |
||
| Total Carbon content from pruned fronds(kg/ha/yr) assuming 50% carbon content of dry weight |
4250 |
|||
|
Carbon loss from soil
|
Depth |
|||
|
0 – 15 cm |
15 – 45 cm |
|||
| Initial value of organic C (%) from Table 2 |
1.30 |
0.92 |
||
| % Change (from Table 3) |
9.69 |
15.76 |
||
| % Loss |
0.12597 |
0.14499 |
||
| Total weight of soil (kg), assuming soil bulk density of 1.1 and 1.25 g cm-3respectively |
1,650,000 |
3,750,000 |
||
| Organic C loss from soil (kg) |
2,076 |
5,437 |
||
| Organic C loss from soil (kg/ha) assuming IR makes up 51% of surface area |
1,060 |
2,773 |
||
| Total organic C loss from soil (kg/ha) for both depths |
3833 |
|||
| Total organic C loss from soil (kg/ha/yr) for both depths with weighted age of 5.4 years2 |
710 |
|||
Source 1: Henson (1999)
Note 2: Weighted age from data of Table 3
The 9.7 % and 15.8% reduction in organic C resulted in a total of 710 kg/ha/yr loss in organic C. Nevertheless, annually more than 4000 kg/ha (Table 4) of carbon can be potentially replenished by the palm’s pruned fronds alone. However, no data is currently available to determine the conversion efficiency of pruned fronds to organic C in oil palm agro-ecosystem in the long-term.
Chew and Pushparajah (1996) reported that organic C increase was not noted in oil palms due mainly to the uneven redistribution of recycled fronds, which could also explain the reduction of organic C obtained by our data set. In general, the IR, where soil sampling is carried out are kept relatively free of pruned fronds and hence no addition of organic matter to this micro-site would occur except from the low density of light vegetation kept by cultural practices, if any. Therefore, the practice of stacking pruned fronds in neat, narrow rows should probably be changed to wider placement covering as much of the IR as possible in view of the above. Establishing vigorous shade tolerant perennial leguminous cover crops such as Mucuna bracteata may offer another option to build up the SOM.
Total N
The Ultisols in Johor have low total N contents with a median value of 0.12 % in the top soil and 0.09 % in the lower depth (Table 2). Total N decreased in both soil depths in tandem with their soil organic C. This implies that most of the total N in the soils is in the organic form. The declines in total N contents contradicted the work of Chew and Pushparajah (1996) and Ling et al . (1979) who reported a lack of changes in soil N under oil palm cultivation.
The drop in total N in the first soil depth was not as accentuated as the second depth (Table 3). This might be ascribed to the higher rooting activity and root turn-over of oil palm in the upper soil depth, which may contribute substantially to the organic C balance (Henson, 1999). Similarly, the higher biological activity of the topsoil and potential addition of organic matter from the oil palm such as pruned fronds, EFB and POME, and the leguminous cover crops during the palm’s immaturity phase might have mitigated the decrease in soil organic C in the first depth and therefore, total N content also compared with the lower depth (Table 3). Nonetheless, the approaches to enhance SOM as suggested earlier are also appropriate to sustain total N content of the soils.
Total and Bray-2 P
The Ultisols in Johor were also generally marginal in P status (Table 2). Phosphate rocks have been used to supplement the P requirement of the oil palm and positive P responses have been obtained (Goh and Chew, 1995b). Despite the regular applications of phosphate rocks in the oil palm estates, total P and Bray-2 P posted increases in the IR only with slight declines in the PC (Table 3). This might be attributed to the policy of applying phosphate rocks in the interrow of mature palms and onto the legumes in immature palms. These results were agreeable with Hartemink (2003) who detected much higher soil P levels in soils under perennial crops compared with natural forest and Ling et al . (1979) who found a build-up of P even when the fields were burned for planting.
The higher increase in Bray-2 P compared with total P following phosphate rock applications corresponded well to the findings of Zaharah (1979). Bray 2-P extracted substantial amount of phosphate rocks apart from the dissolved P, which accentuated the P increase in particular when the initial P values were low (Table 2).
Build-up of both total and Bray-2P was also noted in the upper layer due to surface applications of P fertilizers, the low dissolution of phosphate rocks and slow migration of dissolved P into the lower soil depth due to P fixation or adsorption by sesquioxide. Thus, most of the dissolved P accumulated in the top 30 cm of tropical soils (Zaharah, 1979).
Exchangeable Kand Mg
Most Ultisols also have low exchangeable cations of K and Mg and those in Johor are no exception (Table 2). Even if complete recycling of EFB and POME produced from the FFB yield is to be carried out, the nutrients required by the palms for high yield levels are still higher than the nutrient supply from the oil palm agro-ecosystem (Ng et al ., 1999). Therefore, they need to be augmented by inorganic fertilizers to maintain the yield levels.
This resulted in positive changes to exchangeable K in the IR and both soil depths (Table 3). Slight increase in exchangeable K was also reported by Ling et al . (1979) when improvement in the legume coverage was obtained. Kee et al ., (1995) also noted a four-fold increase in exchangeable K, which were evident to a depth of 60 cm. The build-up of exchangeable K in the IR compared with the PC (Table 3) could be due to the applications of K fertilizers in the former micro-site for mature palms in particular with the wider use of fertilizer spreaders. In addition, pruned fronds and EFB, both containing high amounts of K are also normally applied in the IR.
Exchangeable Mg was noted to decrease for both micro-sites and depths (Table 3) due mainly to the generally high rates of NH4+ fertilizer and KCl fertilizer used, which were known to cause the soil Mg to leach down due to the ionic exchange between the above cations at the soil complex. The magnitude of drop in exchangeable Mg in the PC although not statistically significant, was lower compared with the IR. This might be ascribed to the practice of applying Mg fertilizer, Kieserite, in the former micro-site. The negative soil Mg balance should be arrested with closer monitoring of the soil Mg status and the applications of ground magnesium limestone and/or kieserite where appropriate.
Time / Period
The data were also summarized to coincide approximately with the 3 different practices of land preparation for oil palm planting i.e. burning, which was generally the case in 1982 and earlier, partial burning (1983 to 1993) and the zero burn technique (McCulloch, 1982; Hashim et al ., 1993) which is the most common method from 1994 onwards. We shall discuss the two extreme periods only i.e. the burnt and zero burnt to avoid complication in the interpretation since the partial burnt period might include some fields that were fully burnt or zero burnt.
Burning of the organic palm biomass at replanting had little effect on the long-term soil pH (Table 5) although short-term increase in soil pH had been reported (Ling et al ., 1979), which was attributed to the addition of exchangeable bases in the ash. These two results probably indicated that the ash effect on soil pH was temporary and easily nullified by the applications of acidifying fertilizers to the palms.
With the zero burn technique, soil organic C improved in the IR and in both depths (Table 5). Sly and Tinker (1962) also concurred that slight depression of organic C would be obtained if burning was carried out during land clearing. Similarly, Ling et al . (1979) reported reduction of soil organic C by burning in a jungle clearing although slight increase in the topsoil organic C was noted twelve months after the land clearing. Khalidet al . (2000) also found that different replanting policies of partial burning, stacking and pulverizing resulted in varied increases in soil organic C with the latter two methods yielding the highest increases.
Table 5 : % change for each soil chemical property (parameter) based on median for different periods
|
Parameter / Variable
|
Median change (%) of each parameter at 2 sites and 2 depths during burnt, partial burnt and zero burnt period |
||||
|
Site |
Depth |
||||
|
IR |
P. Circle |
0-15 cm |
15-45 cm |
||
|
pH
|
Burnt |
-3.49 |
-2.35 |
-2.41 |
-3.21 |
|
Partial Burnt |
-3.63 |
-1.04 |
-1.61 |
-2.49 |
|
|
Zero Burnt |
-1.75 |
-2.24 |
-2.95 |
-1.59 |
|
|
Organic C (%)
|
Burnt |
-9.63 |
– |
-5.49 |
-11.67 |
|
Partial Burnt |
-18.97 |
– |
-12.43 |
-24.57 |
|
|
Zero Burnt |
7.77 |
– |
1.87 |
15.56 |
|
|
Total N (%)
|
Burnt |
-2.38 |
– |
-1.63 |
-3.88 |
|
Partial Burnt |
-14.31 |
– |
-8.08 |
-19.35 |
|
|
Zero Burnt |
7.03 |
– |
0.00 |
14.29 |
|
|
Total P (mg/kg)
|
Burnt |
-14.37 |
-6.72 |
-6.10 |
-16.94 |
|
Partial Burnt |
9.37 |
0.00 |
17.88 |
-3.28 |
|
|
Zero Burnt |
31.04 |
-4.26 |
-12.47 |
7.80 |
|
|
Bray-2 P (mg/kg)
|
Burnt |
-4.37 |
-20.82 |
-3.45 |
-17.71 |
|
Partial Burnt |
30.07 |
-1.67 |
20.27 |
-2.30 |
|
|
Zero Burnt |
38.42 |
0.89 |
12.00 |
72.04 |
|
|
Exch. K (cmol/kg)
|
Burnt |
18.99 |
0.00 |
9.72 |
13.25 |
|
Partial Burnt |
8.33 |
-5.90 |
0.00 |
-2.94 |
|
|
Zero Burnt |
1.09 |
27.71 |
5.89 |
9.17 |
|
|
Exch. Mg (cmol/kg)
|
Burnt |
-23.30 |
8.25 |
0.00 |
-16.25 |
|
Partial Burnt |
-26.12 |
-30.71 |
-26.42 |
-31.58 |
|
|
Zero Burnt |
58.46 |
22.79 |
23.33 |
58.46 |
|
In general all the major soil nutrients of total N, total P, Bray-2 P and exchangeable Mg improved during the zero burnt period. Soil exchangeable K on the other hand appeared to yield better results when burning was carried out. This was agreeable with the observations made by Sly and Tinker (1962) that burning depressed nitrogen and decreased soil magnesium and calcium but gave larger exchangeable K. The increase in total N during the zero burnt period corresponded with the build up in soil organic C, which implied a large return of N from the previous palm biomass. On the other hand, the large positive changes in Bray 2-P and exchangeable K in the PC could be attributed to the increased P and K fertilizer rates to the palms following the higher yield responses to these nutrients (Goh et al ., 2000). The build-up of soil exchangeable Mg with zero burnt replanting technique will require further work to ascertain.
Extreme Soil Nutrient Changes
Although the median values of soil nutrient changes in the Ultisols under oil palm in Johor were favourable in the light of sustainability, land degradation and the environment, there were extreme values for all the soil chemical properties (Appendices 1c and 1d). These extreme values could be outliers due to sampling or analytical errors but nevertheless it is still prudent to scrutinize them because excessive soil nutrient depletion (negative values) and build-up (positive values) are both detrimental to the oil palm agro-ecosystem. Long-term nutrient depletion is known to cause yield declines in many agricultural crops (Hartemink, 2003) whereas excessive build-up of N and P can cause ground water pollution and eutrophication, respectively. In general, the data showed that build-up of soil nutrients was dominant compared with soil nutrient depletion in the Ultisols under oil palm in Johor (Appendices 1 c and 1 d).
Changes in Soil Properties: Materials and Methods
[addw2p name=”changesInSoilProperties”]
The data used in this paper were extracted from long-term soil analysis results of samples collected from 21 estates from 1967 to 2000. The estates were located from northern to southern Johor along the central belt (Figure 1). They covered over 37,000 ha, of which data from approximately 13,000 ha were used. Only analysis data of Ultisols from Johor were reported in this paper and they encompassed 26 soil series, which were mostly developed over igneous rocks, sedimentary rocks and riverine alluvium. Examples of soils in the study area would include Rengam series (deep coarse sandy clay soil derived from granite), Bungor series (deep fine sandy clay soil derived from sandstone/shale) and Holyrood series (deep coarse sandy clay loam soil derived from sub-recent alluvium).

Sampling Method
36 soil-sampling sites were randomly located in a representative area of each field. At each sampling site, soil samples were collected from two micro-sites of palm circles (PC) and interrows (IR) using a 2.5 cm diameter screw auger. At each micro-site, soil samples from two depths of 0 – 15 cm and 15 – 45 cm were extracted. This gave four distinct soil samples (two micro-sites x two depths) for each field, which were each bulked from the soil samples taken from the 36 sampling sites.
Chemical Analysis
Each soil sample was analyzed for some or all of the soil chemical properties listed in Table 1. We also restricted the data set to soil samples where they were collected and analyzed at the same time for two different soil depths and/or sites in each field. Thus, the number of samples available varied among the soil chemical properties (Table 1).
Soil pH was determined in the supernatent suspension of 1:2.5 soil: water. Organic carbon was analysed by the Walkey-Black procedure while total N was extracted using micro-Kjeldahl method. Total P was extracted using 6M HCl whereas available P followed Bray No. 2 procedure. Exchangeable K, Mg and Ca were extracted by leaching the soil sample with 1 M ammonium acetate solution at pH 7.0. K was then determined using flame photometer while Mg and Ca were determined using atomic absorption spectrophotometer. Details of the above analytical methods can be found in Moris and Mohinder (1980).
Table 1: Number of soil samples analyzed for each soil chemical property
|
Number of soil samples analyzed |
|||||
|
IR |
PC |
||||
| Soil chemical properties |
0-15 cm |
15-45 cm |
0-15 cm |
15-45 cm |
Total |
| pH |
372 |
372 |
372 |
372 |
1488 |
| Organic C (%) |
599 |
599 |
– |
– |
1198 |
| Total N (%) |
599 |
599 |
– |
– |
1198 |
| Total P (mg/kg) |
263 |
263 |
263 |
263 |
1052 |
| Bray-2 P (mg/kg) |
400 |
400 |
400 |
400 |
1600 |
| Exch. K (cmol/kg) |
412 |
412 |
412 |
412 |
1648 |
| Exch. Mg (cmol/kg) |
376 |
376 |
376 |
376 |
1504 |
Soil Nutrient Changes
Quantifying the rates of change in soil chemical properties for different soils and climate is necessary to reckon if any, the soil fertility decline as very few studies have been conducted in which these rates were calculated (Hartemink, 2003). In this paper, the rate of change was calculated for each soil chemical property as follows (Hartemink, 2003):

where Δ = the rate of change in %
x 1 = the initial value of the variable at sampling time t 1
x 2 = the final value of the variable at sampling time t 2
The soil samples where x 1 and x 2 were determined came from the same field. The period between the soil samplings t 2– t 1varied from one to 13 years.
Statistical Analysis
The main descriptive statistics such as mean, median, minimum, maximum, standard deviation, standard error of mean were calculated to examine the means and distributions of the initial value (x 1) and change (%) for each soil chemical property (Appendices 1a to 1d).
Since the rate of change (%) for each soil chemical property was not normally distributed, non-parametric statistics and median were used to analyze the data. Wilcoxon’s signed rank test (Steel and Torrie, 1981) was used to investigate the differences in the rate of change (%) of each soil chemical property between the two sites of IR and PC, and between the two soil depths (0-15 cm vs. 15-45 cm).
In the Wilcoxon’s signed rank test, the sample size (Table 2) did not equal to half the number of soil samples collected (Table 1). This was because in calculating the rate of change (%), we took two soil samples (x 1 and x 2) that were collected from the same field but at different sampling periods (t1 and t2). This implied that if a field was sampled twice at two different sampling periods, then the sample size equaled to one. On the other hand, if a field was sampled three times, then the sample size equaled to three, i.e. the rates of change (%) were calculated fromx 1 and x 2, x 2 and x 3 as well as x 1 and x 3. The same applies for other soil samples taken at different periods from the same fields i.e. four sampling periods would yield a sample size of four.
Changes in Soil Properties: Introduction
[addw2p name=”changesInSoilProperties”]
The oil palm requires large amount of nutrients to sustain its growth and production so that high yield levels of 30 tons/ha/yr (Ng et al ., 1999) or more could be achieved and maintained. This is mainly due to the low soil fertility in most Malaysian soils (Law and Tan, 1973) in particular the Ultisols of Johor (Ng, 1969). High fertilizer rates are also essential to prevent negative soil nutrient balance and in many instances, to build-up the soil fertility to ensure sufficient nutrients are present in the soil solution for maximum uptake by the roots (Goh and Chew, 1995a).
Traditionally, soil samples are taken on a regular basis for nutrient analysis and are commonly used in the diagnosis of fertilizer requirements in oil palms, monitoring soil fertility and ensuring that fertilizers recommended have been applied. Thus, large long-term data set on soil nutrients are available from most big plantation houses. Despite this, changes in soil nutrients under oil palm as influenced by agro-management practices have not been reported. This is particularly important as the issues of soil nutrient changes have since gone beyond their traditional uses and are nowadays frequently regarded as one of the most important measures of sustainability and impact on the environment. Tinker (1993) pointed out that for an agriculture crop to be sustainable, one of the criteria should include preserving the resource base on which it rests upon whereas Hartemink (2003) has also argued that a drop in world food production might be attributed to the decline of soil nutrients. Soil nutrient changes with regards to the impact on the environment would normally be scrutinized from the point of land degradation and potential pollution, which should be avoided in order to be sustainable.
This paper studies the soil nutrient changes of pH, organic carbon, total nitrogen, total and Bray-2 phosphate and exchangeable potassium and magnesium in different micro-sites (palm circles and interrows) and depths under oil palms. The effects of time and the different replanting practices from previously on soil nutrient changes were also investigated.
Soil Management: Changes in Soil Properties
[addw2p name=”changesInSoilProperties”]
Abstract
The soil nutrient changes under oil palm need to be examined to ensure agro-management practices go along the lines of sustainability and not harm the resource base on which the oil palm rests upon. As most large plantation houses carry out regular soil sampling of their fields for the diagnosis of fertilizer requirements and monitoring soil fertility, long-term data are available to study the soil nutrient changes of pH, organic carbon, total nitrogen, total and Bray-2 phosphate and exchangeable potassium and magnesium in different micro-sites (palm circles and interrows) and depths. The effects of time and different replanting practices on soil nutrient changes were also investigated. This study was restricted to the Ultisols in Johor.
Results indicated that soil pH, organic C and total N tended to decrease with time in the oil palm agro-ecosystem. However, the decline in soil pH was slight whereas those related to organic C and total N corresponded to the period where the oil palm biomass was burnt or partially burnt at replanting. The large increases in soil organic C with the current norm of zero burn replanting technique were favourable with regard to sustainability and land degradation. There were large positive changes in soil P and exchangeable K, which might be attributed to the applications of higher rates of phosphate rocks and K fertilizer especially from the 1990s following the results of fertilizer response trials. Exchangeable Mg tended to decrease with burn or partial burn replanting techniques but showed large increases in both micro-sites and soil depths with zero burn techniques. Excessive build-up of soil nutrients on the highly weathered tropical soils of Ultisols should be avoided due to their generally low nutrient holding capacity, which may increase the risk of pollution. On the other hand, nutrient depletion should also be prevented as they commonly lead to lower production in the long-term.
This study shows explicitly that the soil fertility status of the Ultisols under oil palm in Johor has been enhanced through current fertilizer management practices and zero burn replanting technique.
Reference
Ng PHC, Gan HH and Goh KJ (2004) Soil nutrient changes in Utisols under oil palm in Johor, Malaysia. In: Oils and Fats International Congress (OFIC) 2004 in module on Agriculture, Biotechnology and Sustainability (AB), 29-9 to 2/10 2004, PWTC, Kuala Lumpur: Preprint.
Note: The full list of references quoted in this article is available from the above paper.
Soil Profiles: Ulu Dong

Ulu Dong Series
The Ulu Dong Series is a member of the family of very fine, kaolinitic, isohyperthermic, red Tipik Lutualemkuts. It is developed over quartz-mica-schists. They are characterized here by their deep kandic horizons with a clay content of more than 60% with no significant decrease to 100 cm of the soil surface and their red to yellowish red colours. Structures are weak medium and coarse subangular blocky and consistence is friable. Patchy clayskins occur on ped faces. The CECclay is less than 16 cmol (+) in all horizons between 25 to 100 cm of the soil surface.

Type Location
The Ulu Dong Series were first described and studied by Lim (1977) near Dong village to the east of Raub. The above pedon was also described by Lim during the Detailed Reconnaissance Soil Survey of the KESEDAR Region, Ulu Kelantan (Lim et al. 1980) at the 57 km (36 milestone) Tanah Merah to Batu Melintang Road over quartz-mica-schists at an elevation of 103 m (340 feet) under secondary forest on hilly terrain. Location: Topographic Sheet 3867, 5°49′ N, 102°00′ E (Grid Reference 3867 – 440430 m).
Range in Characteristics
Little is known about the range in characteristics of the Ulu Dong Series. The main characteristics are that these soils must be deep and have a clay content of over 60% and the clay content should not decrease from the maximum by more than 20% within 100 cm of the soil surface. Some soils with about 55% clay have also been mapped as Ulu Dong Series in the past. Colours in the subsoils belong to the red colour class. Subsoil colours range from yellowish red (5YR4/6, 5/6, 5/8) to red (2.5YR3/6, 4/6, 4/8, 5/6, 5/8, 6/6, 6/8) to light red (2.5YR7/6, 7/8). The colours normally become redder with depth. Structures are weak coarse and medium subangular blocky and consistence is friable. Clayskins occur on ped faces. Mottling is rare and if present is faint.
Competing Soils and Their Differences
Soils of the Ulu Dong Series are likely to be confused with other red-coloured soils which have heavy clay (> 60% clay) textures. These include soils of the Patang, Prang, Kampong Kolam, Apas, Tarat and Sagu Series. All these soils have an oxic horizon while the Ulu Dong Series has a kandic horizon. The Langkawi Series over limestone has many properties similar to the Ulu Dong Series. The Ulu Dong Series generally has lower clay contents and some sand while the Langkawi Series higher clay content and virtually no sand. In Sabah no red-coloured soils with a deep kandic horizon have been mapped but some soils mapped as the Kumansi Series/deep/red variant may have some features similar to the Ulu Dong Series but the Kumansi Series normally have a CECclay of more than 24 cmol (+) kg–1 clay. Soils of the Chat Series (CECclay less than 16 cmol, red-yellow colour class), Melugu (CECclay 16–24 cmol, red-yellow colour class) and Stass (CECclay more than 24 cmol, red-yellow colour class) are similar textured but differ in CECclay values and subsoil colours. The Jakar Series has red colours but has 35–60% clay and a CECclay of more than 24 cmol.
Setting
Soils of the Ulu Dong Series to-date have been mapped on rolling, hilly to steep terrain (slopes in excess of 12% or 6°) at elevations of 30 m to over 200 m (100– 700 feet).
Principal Associated Soils
The Ulu Dong Series has been mapped in association with soils of the Chat Series (CECclay less than 16 cmol, red-yellow colour, clay content more than 60%). Occasionally they have also been mapped in association with soils of the Bungor Series (CECclay less than 16 cmol, clay content 35 to 60%, red-yellow colour class).
Drainage and Permeability <
Soils of the Ulu Dong Series are deep, well drained soils with a good permeability.
Use and Vegetation
Rubber, fruit trees and oil palm are the commonest crops grown on soils of the Ulu Dong Series. Some of these soils may still be under primary forest.
Distribution and Extent
Soils of the Ulu Dong Series have to-date been only mapped in the states of Kelantan, Pahang and Johor. Their actual extent is not fully known.
Series Established
The series was established by Lim (1977) during soil surveys in Pahang State. The source of name is the Kampong Ulu Dong off the Raub-Benta road, Pahang State, Peninsular Malaysia.
Remarks on Classification
Soils of the Ulu Dong Series are classified here according to the Malaysian Soil Taxonomy – Second Approximation (Paramananthan 1998) as a member of the very fine, kaolinitic, isohyperthermic red family of Tipik Lutualemkuts. They are classified as deep, well drained soils having a kandic horizon with red colours and a clay content in excess of 60%. In the Keys to Soil Taxonomy – Eighth Edition (Soil Survey Staff 1998) soils of the Ulu Dong Series are probably classified as Typic Kandiudox. In the FAO/UNESCO Soil Map of the World – Revised Legend (FAO 1990) these soils would probably be Haplic Nitisols.
Suitability for Agriculture
Soils of the Ulu Dong Series are probably suitable for a wide range of crops with proper management. The slope on which these soils occur, their low fertility status and phosphorus fixation are the main limitations. With good management these soils should be suitable for a wide range of crops such as oil palm, rubber, fruit trees, pepper and cocoa.

Soil Profiles: Table

Table Series
The Table Series is a member of the Table Family which is very fine, oxidic, isohyperthermic, brown Tipik Tempalemoks. It typifies this family and is developed over basalts (basic igneous rocks). Soils of the Table Series are characterized by their deep heavy clay textured oxic horizons with dark yellowish brown colours and an ECEC that is more than 1.5 cmol (+) kg–1 clay in all horizons between 25 to 100 cm depth. Structures are weak, medium to fine subangular blocky and consistence is friable.

Type Location
Soils of the Table Series were first established by Paton (1963) during the Reconnaissance Soil Survey of the Semporna Peninsula. The above pedon was described by staff of the Department of Agriculture, Sabah in the Quoin Hill Agriculture Station near Tawau, Sabah on undulating terrain (4–12% or 2–6° slopes) at an elevation of 200 m (600 feet) under oil palm. Location: Topographic Sheet 4/118/9, 4°03’35” N, 118°01’30” E (Grid Reference 4/118/9 – 915845 m).
Range in Characteristics
Little is known about the range in characteristics of this soil. The colours range from dark yellowish brown (10YR4/4, 4/6, 3/4, 3/6) to dark brown (7.5YR3/2, 3/3, 3/4) and brown (10YR4/3, 4/6 and 7.5YR4/3, 5/3 and 4/4, 5/4). Textures are uniformly heavy clays. These soils are deep and somewhat excessively drained. Structures are weak to moderate medium and fine subangular blocky and consistence is friable. Little is known about the range in chemical characteristics but as noted earlier the permanent charge values range from around 1.0–5 cmol (+) kg–1 clay.
Competing Soils and Their Differences
The typical brown colours of the Table Series is not likely to be confused with many other soils. Soils of the Kuantan Series have many characteristics similar to those of the Table Series and only the permanent charge values separates these two soil types. Soils of the Ambun Series are yellowish red to dark reddish brown in colour (hues of 5YR or 2.5YR) and are developed over ultrabasic rocks on steep slopes. Soils of the Katai Family over alluvium from basic and ultrabasic rocks ranges in colour from reddish brown to yellowish brown but have an argillic horizon. Soils of the Besar Series also have similar colours but have an argillic horizon with high base saturation values. Soils of the Tangga Series and the Sagu Series may also have similar colours but are developed over limestone parent material. The Nobusu Series has similar colours and chemical characteristics but has lower clay contents (35–60%) and is developed on alluvia from basic/ultrabasic rocks.
Setting
Soils of the Table Series typically occur on undulating to rolling terrain (4–24% or 2–12° slopes) at elevations of less than 200 m (< 600 feet).
Principal Associated Soils
Soils of the Table Series have to-date been only mapped in the Tawau-Semporna area in Sabah in association with the Apas Series and the Katai Series. The Apas Series is red in colour while the Katai occurs over alluvia and on undulating to level terrain and has an argillic horizon. As mentioned earlier those with a cation retention capacity of less than 1.5 cmol (+) kg–1 clay should be reclassified as the Kuantan Series.
Drainage and Permeability
Soils of the Table Series are generally well to somewhat excessively drained. Permeability is also generally good.
Use and Vegetation
In the Tawau area in Sabah where these soils have been mapped they have been mainly under oil palm, or logged primary forest. On the Quoin Hill Station where these soils occur other research plots with other cash crops and cocoa were also present.
Distribution and Extent
The Table Series has to-date been only mapped in the Tawau area in Sabah around Quoin Hill. The actual extent of these soils is not known.
Series Established
This soil was established by Paton (1963) during the Reconnaissance Soil Survey of the Semporna Peninsula. The source of name is not known.
Remarks on Classification
The Table Series is classified here according to the Malaysian Soil Taxonomy – Second Approximation (Paramananthan 1998) as a member of the very fine, oxidic, isohyperthermic brown family of Tipik Tempalemoks over basalt parent material. They are classified here as deep soils that have clayey brown coloured oxic horizon in which the permanent charge is more than 1.5 cmol (+) kg–1 clay. In the Keys to Soil Taxonomy – Eighth Edition (Soil Survey Staff 1998) these soils would probably be classified as Typic Hapludox. In the FAO/ UNESCO Soil Map of the World – Revised Legend (FAO 1990) the Table Series would probably be classified as Haplic Ferralsols.
Suitability for Agriculture
The main limitation for agriculture in these soils is their generally low fertility status, high P fixation, and their high permeability. They should be suitable for a wide range of crops.

Soil Profiles: Serdang
Serdang Series
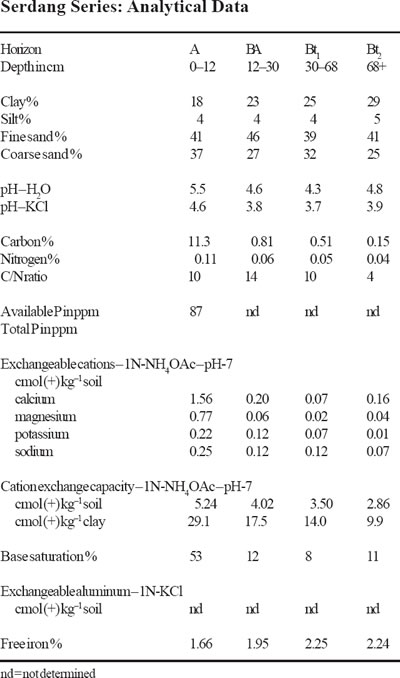
The Serdang Series is a member of the family of fine loamy, siliceous, isohyperthermic, red-yellow Tipik Lutualemkuts. The Serdang Series is developed over mixed sedimentary rocks. They are developed on quartzite, sandstone or conglomerate parent material and are characterized by deep profiles having sandy loam to sandy clay loam textures. They range in colour from yellowish brown to strong brown. Structures are weak subangular blocky and consistence friable. These soils have a kandic horizon (CECclay < 16 cmol (+) kg–1 clay) which is weakly expressed but clay content increases gradually with depth. The CECclay is less than 16 cmol in all subhorizons between 25 to 100 cm depth. No significant clay decrease to 100 cm depth is allowed.
Type Location
The Serdang Series was first established during the survey of the Federal Experimental Station in Serdang by Panton (1954), near Kuala Lumpur. The above pedon was described by Vercruysse (1984) during the Semi-Detailed Soil Survey of the Gual-Periok area, Kelantan on the lower slopes of a low hill at an elevation of 20 m under rubber. Location: Topographic Sheet 3868, 6°01’35” N, 102°01’45” E (Grid Reference 3868 – 480667 m).
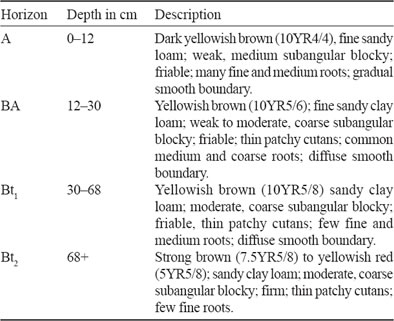
Range in Characteristics
Soils of the Serdang Series in spite of its widespread occurrence show fairly consistent morphological properties. The textures range from fine sandy loam, sandy loam, to fine sandy clay loams, in the surface horizon to fine sandy clay loam in the subsoil. The texture often becomes heavier (sandy clay) at depths around 100 cm. Fine sand dominates the sand fraction. Clay contents range from about 18% to about 35% within 50 cm of the surface. Only rarely do heavier textures occur. Colours are uniformly yellowish brown to brownish yellow (10YR5/6, 5/8, 6/6, 6/8). With depths the colours may be strong brown, reddish yellow (7.5YR5/6, 5/8, 6/6, 6/8, 7/6, 7/8; 5YR6/6, 6/8, 7/6, 7/8). The redder colours are more common on the steeper slopes. A red variant with red colours (10R4/6, 4/8, 5/6, 5/8; 2.5YR4/6, 4/8, 5/6, 5/8) has been mapped near Paloh in Johore but this is now included with the Laka Series. Structures are weak to moderate, medium and fine subangular to angular blocky and consistence friable even to over a metre depth. Occasionally a thin vein quartz band may be present but petroplinthite nodules are rare as a rule. These soils have thin patchy clayskins to depths over one metre. The soils are more than one metre deep. On the steeper slopes it grades into the shallower soils of the Nami and Kekura Series. On the footslopes these soils may have a few diffuse mottles at depth. As defined here soils of the Serdang Series must have a CECclay of less than 16 cmol (+) kg–1 clay in all subhorizons between 25 to 100 cm depth.
Competing Soils and Their Differences
Soils of the Serdang Series are not likely to be confused with many other soils. The Kekura and Kedah Series have similar features but the soil depth is less than 50 cm. The Nami and Keledang Series are also similar textured but soil depth ranges from between 50 to 100 cm. The Bungor Series is heavier textured, slightly stronger coloured and has relatively firmer consistence. Mottling is also invariably present in the Bungor Series. The Kemahang Series has all the features of the Serdang Series but the textures are coarse sandy clay loams. Soils of the Serdang Series can be confused with soils of the Bekenu Series (CECclay 16–24 cmol) and the Tanjong Lipat Series (CECclay > 24 cmol) mapped in Sarawak and Sabah but can be separated using the CEC values. Soils of the Serdang Series may be sometimes confused with terrace alluvial soils such as the Holyrood and Rasau Series. These soils occur level to gently undulating on river terraces. The Holyrood has coarse sandy clay loam. While the Rasau fine sandy clay loam textures. Soils of the Tukau Series in Sarawak are also developed on terraces. These soils on terraces get paler with depth and often rounded-pebbles are encountered. Soils of the Serdang Series are not likely to be confused with many other soils. The Kekura and Kedah Series have similar features but the soil depth is less than 50 cm. The Nami and Keledang Series are also similar textured but soil depth ranges from between 50 to 100 cm. The Bungor Series is heavier textured, slightly stronger coloured and has relatively firmer consistence. Mottling is also invariably present in the Bungor Series. The Kemahang Series has all the features of the Serdang Series but the textures are coarse sandy clay loams. Soils of the Serdang Series can be confused with soils of the Bekenu Series (CECclay
Setting
The Serdang Series soils occur on undulating to hilly terrain on quartzite, sandstone and conglomerate parent material. They may occupy the gentler slopes of steep ridges with the Kekura and Nami Series occurring on the steep ridge tops.
Principal Associated Soils
Soils of the Serdang Series have been often associated with soils of the Bungor, Munchong and with the Nami and Kekura Series. The Munchong Series is clayey textured, stronger structured and has an oxic horizon. The Bungor Series also has heavier textures with fine sand dominating. Consistence is also firmer and has reddish mottles at depth. The Nami and Kekura Series are shallower soils in which the parent material is encountered at depths within 100 and 50 cm respectively. As redefined here soils of the Serdang Series may be associated with soils of the Bekenu and Tanjong Lipat Series.
Drainage and Permeability
The Serdang Series is a well drained soil to over 100 cm depth. It has good permeability.
Use and Vegetation
A large variety of crops are grown on these soils. These include crops such as oil palm, rubber, fruit trees etc. Many areas with such soils are still under primary forest.
Distribution and Extent
To-date, except for the State of Perlis, these soils have been mapped in every state in Peninsular Malaysia. They have mainly been mapped in association with other soils and consequently their actual extent is not known. These as defined here may also be present in Sabah and Sarawak.
Series Established
This soil was established during the survey of the Federal Experimental Station in Serdang (Panton 1954). The source of name is Serdang Village near Kuala Lumpur.
Remarks on Classification
Soils of the Serdang Series are classified according to the Malaysian Soil Taxonomy – Second Approximation (Paramananthan 1998) as a member of the fine loamy, siliceous, isohyperthermic, red-yellow family of Tipik Lutualemkuts. They are classified as soils having a deep kandic horizon with between 18 and 35% clay content. In the Keys to Soil Taxonomy – Eighth Edition (Soil Survey Staff 1998), soils of the Serdang Series would probably be Typic Kandiudults. In the FAO/ UNESCO Soil Map of the World – Revised Legend (FAO 1990) the Serdang Series would be classified as Haplic Nitisols.
Suitability for Agriculture
The deep, friable soils of the Serdang Series appear to be well suited for a wide range of crops. However these soils on account of their loamy texture and friable consistence are prone to erosion. Thus the terrain and consequently their erodibility are limitations for the utilisation of these soils. These soils also have a low fertility status and moisture retention capabilities. Thus in areas prone to moisture stress these soils should be managed more carefully.
Soil Profiles: Sabrang

Sabrang Series
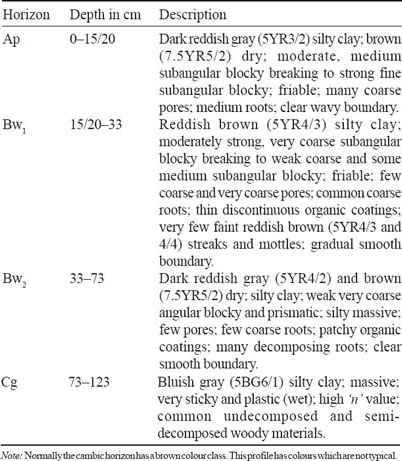
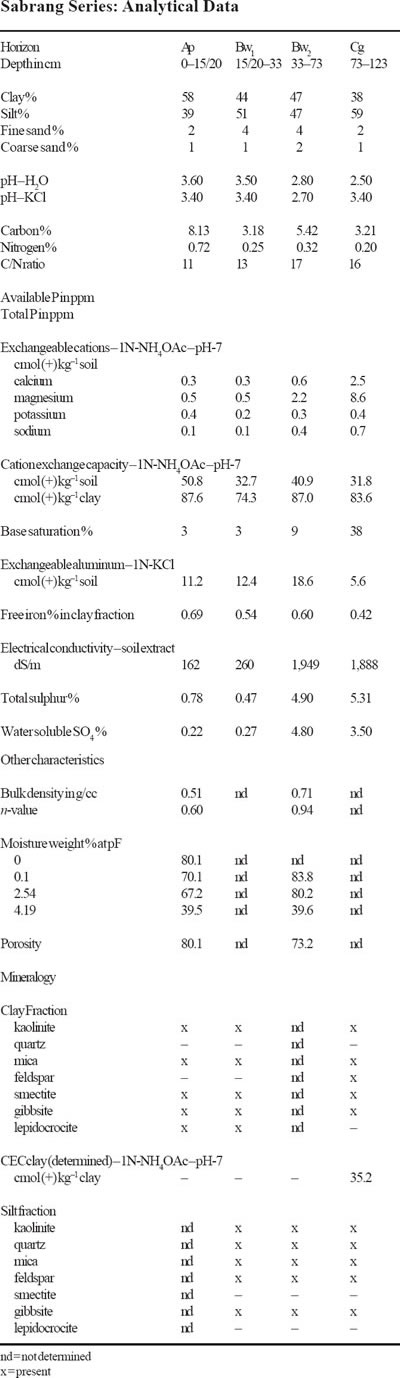
The Sabrang Series is a member of the family of fine, mixed, isohyperthermic, brown Tipik-Sulfidik Tempajelahs. They are developed over brackish water deposits. These soils have a brown to dark brown silty clay A horizons overlying a brown to reddish brown silty clay cambic B horizon which extends to a depth of below 50 cm. This is underlain by a unripe silty clay bluish gray marine clay which is sulfidic. The structures in the B horizons range from weak coarse angular blocky to moderate medium subangular blocky.
Type Location
The Sabrang Series was initially mapped as the Jawa Series (B) by staff of the National Soil Survey during the Semi-detailed Survey of Johor Barat Phase II and that of Northwest Selangor. The name Sabrang Series was however used by staff of the Rubber Research Institute for such soils mapped in Lower Perak. In their original definition, soils of the Sabrang Series are underlain by either sulfidic or non sulfidic material. In the present redefinition the Sabrang Series has sulfidic materials below 50 cm while the Metah Series has non-sulfidic material. Noordin Daud (1980) described the above pedon in Sabrang Estate south of Telok Intan in Perak. This profile is now taken as the type locality. Location: Topographic Sheet 3460, 4°02’10” N, 100°57’40” E (Grid Reference 3460 – 297468 m).
Range in Characteristics
The Sabrang Series often has a surface horizon which is clay to silty clay and has a colour which ranges from black to dark brown, dark grayish brown to dark gray (10YR2/1, 3/3, 4/1, 4/2, 4/3; 7.5YR3/2, 4/2, 4/4) and has structures of moderate to strong medium to fine angular and subangular blocky structures and friable consistence. The B horizon extends to a depth of less than 100 cm but more than 50 cm and has silty clay to clay textures and have dark brown, brown, dark grayish brown and grayish brown (10YR3/3, 4/2, 4/3, 5/2, 5/3 and 7.5YR4/2) colours. Structures in the upper part of the B horizon are moderate to strong medium angular to subangular blocky but grades with depth to a coarse angular blocky to prismatic. Consistence similarly changes from friable to slightly sticky with depth. The underlying unripe marine clay is greenish gray, dark greenish gray or bluish gray (5GY4/1, 5/1, 6/1; 5G4/1, 5/1, 6/1; 5BG4/1, 5/1, 6/1) silty clay with massive structures and very sticky and plastic consistence. This marine clay commonly occurs at depths of around 70–80 cm. This material in the Sabrang Series is sulfidic.
Competing Soils and Their Differences
Soils of the Sabrang Series may be confused with soils of the Sedu Series, Jawa Series, Metah Series and Serkat Series. All these soils are also characterized by brown colours, silty clay textures and moderate structures. However the Sedu Series and Jawa Series both are acid sulfate soils and hence have sulfuric horizons at varying depths. The Serkat Series does not have a sulfuric horizon but is differentiated from the Sabrang Series by the depth which the marine clay is encountered. In the Serkat Series the marine clay is encountered within 50 cm of the surface. The Metah Series has non-sulfidic materials below the cambic horizon but within 100 cm. The Selangor Series does not have the marine clay within 100 cm of the surface. In Sabah, soils of the Weston Family (Thionic Fluvisols) which when drained could develop into the Bergosong Family (Thionic-Humic Gleysols) which may resemble the Sabrang Series but more data is required to correlate these soils. Similarly in Sarawak the Rampangi Series and Punda Series (Thionic Soils) when drained could develop into soils similar to the Sabrang Series.
Setting
The Sabrang Series forms a sequence of soils with the Serkat Series and Selangor Series with the Serkat Series being the poorer drained with the Sabrang Series in the intermediate position. These soils are often formed when the brackish water swamps are drained. They often occur between the marine clay soils near the coast and the peat swamps.
Principal Associated Soils
Soils of the Sabrang Series are often associated with soils of the Selangor Series, Serkat Series, Sedu Series and Jawa Series. Both the Sedu Series and Jawa Series are acid sulfate soils and have a sulfuric horizon. The Selangor Series and Serkat Series differ from the Sabrang Series in the depth at which the marine clay is encountered.
Drainage and Permeability
The Sabrang Series are somewhat poorly to poorly drained soils. They have a permanent groundwater table between 50 to 100 cm depth. The permeability in the B horizon is often good.
Use and Vegetation
The Sabrang Series is a man-made soil formed by artificial drainage. They are cultivated mainly with oil palm, rubber, coconut, cocoa and coffee. Some vegetables and cash crops are also sometimes grown on these soils.
Distribution and Extent
The soils of the Sabrang Series are only recently established and hence their actual distribution is not known. They have to-date been mapped in Perak, Selangor, Johor, Pahang and Terengganu.
Series Established
This soil was formerly mapped as a variant of the Jawa Series but is now upgraded to a full series. The source of the name is Sabrang Estate, Telok Intan, Perak, Peninsular Malaysia.
Remarks on Classification
The Sabrang Series is classified here according to the Malaysian Soil Taxonomy – Second Approximation (Paramananthan 1998) as a member of the fine, mixed, isohyperthermic, brown family of the Tipik-Sulfidik Tempajelahs. This classification is based on the premise that these soils have a cambic horizon which has an aquic moisture regime with a sulfidic marine clay occurring between 50 to 100 cm from the soil surface. In the Keys to Soil Taxonomy – Eighth Edition (Soil Survey Staff 1998) the Sabrang Series would probably be Sulfic Endoaquepts. In the FAO/UNESCO Soil Map of the World – Revised Legend (FAO 1990) the Sabrang Series would probably be classified as Thionic Fluvisols.
Suitability for Agriculture
This is a relatively good soil which can support a wide range of crops. The soil has more than 50 cm of good friable soil without any acid sulfate conditions. Thus the shallow and moderately deep rooted crops can be easily grown on this soil. Crops such as cocoa, coconut, oil palm, coffee and vegetables should do well on these soils. Water management in these soils is essential.
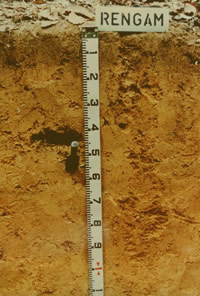
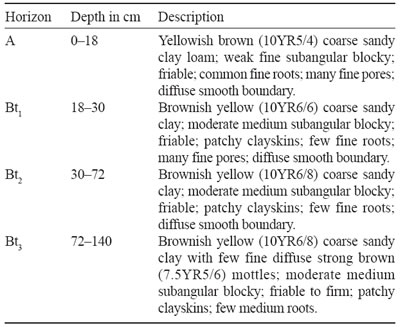
Soil Profiles: Rengam
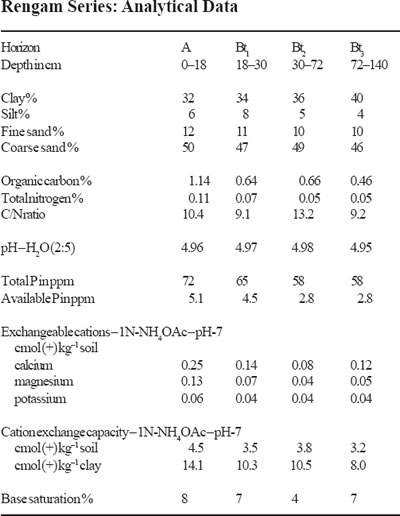
Rengam Series
The Rengam Series is a member of the Rengam Family which is a fine, kaolinitic, isohyperthermic, red-yellow Tipik Lutualemkuts. It typifies this family which is developed over coarse grained acid igneous rocks. The soils have a thin brown coarse sandy clay loam A horizons and deep uniform brownish yellow to yellowish brown coarse sandy clay to clay B horizons. The soils have moderately developed medium subangular blocky structures and friable consistence which gets firmer with depth. The soils occur on undulating, rolling and hilly terrain. They are derived from granitic parent material. Chemically these soils have a CECclay of less than 16 cmol (+) kg–1 clay in all subhorizons between 25 to 100 cm depth.
Type Location
The soils of the Rengam Series were first established in the Simpang Rengam area of Johore possibly by Owen or Jansen. The soil was subsequently described by Panton during the Reconnaissance Soil Survey of Terengganu. The above pedon was described in the Agricultural Museum, near Kuantan, Pahang on rolling terrain (16% slope) at an elevation of 50 m (150 feet). Location: Topographic Sheet 4360, 3°48′ N, 103°20′ E (Grid Reference 4360 – 930210 m).
Range in Characteristics
The A horizon of the Rengam Series is often a brown to dark brown (10YR4/ 3, 5/3) coarse sandy clay to coarse sandy clay loam. The B horizon are often uniform and deep. The colours in the B horizons are uniformly brownish yellow to yellowish brown (10YR6/8, 6/6, 5/6, 5/8), and strong brown (7.5YR5/6, 5/8). The textures in the B horizons range from coarse sandy clay through sandy clay to clay. The clay percentage ranges from 30 to 55% and seldom exceeds 60%. Invariably coarse sand dominates the sand fraction by a ratio of more than 3:1. The Rengam Series as mapped in the past had much wider range in properties and a coarse sandy type (actually gravelly type), a red variant and a clay type were also mapped. These are however now excluded from the Rengam Series. The Rengam Series as redefined here cannot have hues of 5YR or redder within the upper 50 cm (Rengam/red variant). The amount of gravels in the upper 50 cm cannot exceed 35% (Beserah Series). The dominance of the coarse sand (often as high as 30–40%) makes the field texture sometimes difficult to assess. Structures in the B horizons are moderate to weak medium subangular blocky and consistence friable. Clayskins are developed but they are often best developed at depths below 50 cm. The profiles are often very deep and exceed 3–4 m before the weathered rock is encountered. With depth the colours become redder and gravel content gradually increases.
Competing Soils and Their Differences
The Rengam Series as mapped in the past had a fairly wide range. It is therefore redefined here to only include soils derived from granitic parent materials and which have the upper part of the B horizons having brownish yellow or yellowish brown or strong brown colours and coarse sandy clay to clay textures. They have a clay distribution which does not decrease significantly with depth (to 1.0 m) and have a kandic horizon (CECclay less than 16 cmol (+) kg–1 clay in all horizons within the 25 to 100 cm depth. The Rengam Series as redefined here is commonly associated with soils such as the Beserah and Baling Series. The Rengam Series is also often associated with soils of the Tampin Series. The Beserah Series has many features similar to that of Rengam Series but has a gravelly clay texture within 50 cm – gravel content exceeds 35%. The Bukit Temiang Series is easily differentiated from the Rengam Series by the appearance of the weathered parent material within one metre of the soil surface. The Baling Series also has a clay distribution which often decreases with depth. The Lambak and Bukit Temiang Series are differentiated from the Rengam Series by their redder hues (5YR and 2.5YR) which appear within 50 cm of the soil surface. The Tampin Series on the other hand has much paler colours – yellow to olive colours in the upper part of the B horizon. The Rengam Series is also often associated with soils of the Jerangau Series. They are however easily distinguished from the Jerangau by the coarse sand of the Rengam Series. The Harimau Series formed on colluvial wash and Older Alluvium derived from granites is very similar to the Rengam but it (Harimau) has shallower profiles with rounded gravels often encountered at depths below 100 cm. The coarse sand in the Harimau Series is also less angular and has a clouded appearance. The Rengam has a coarse sand-fine sand ratio of about 3:1 or greater while the Harimau 1.5:1. The Harimau Series also has much weaker structures and generally the colours become paler with depth. Other soils derived from sandstones and quartz mica schists such as Serdang, Bungor and Batang Merbau have colours similar to the Rengam Series but lack the typical angular quartz in the coarse sand fraction. These soils also have a higher proportion of fine sand. No granitic derived soils with similar features to the Rengam Series have been mapped to-date in Sabah. In Sarawak, the Abok and Gumbang Series over acid igneous rocks have a fine loamy particle-size class.
Setting
The Rengam Series as redefined here occurs on slopes ranging from gently undulating through rolling to hilly and steep. They are more common on the undulating and hilly terrain while the Baling and Bukit Temiang Series are common on hilly to steep terrain. The Rengam Series occur on elevations ranging from 50–200 metres (150–650 feet).
Principal Associated Soils
The Rengam Series as defined here is commonly associated with soils of the Lambak, Beserah and Bukit Temiang and Baling Series. The Rengam Series soils are however distinguished from these by the lower gravel content in the profile. These soils have gravelly clay textures or are shallower profiles. The Bukit Temiang and Lambak Series also have redder hues within 50 cm of the surface. The Jerangau Series has a strong brown colours and clayey textures and lacks the angular quartz. The Lanchang Series has more than 60% clay.
Drainage and Permeability
Soils of the Rengam Series are well drained and the permeability is good.
Use and Vegetation
The Rengam Series has been planted with a wide range of crops. Rubber, oil palm, fruit trees, pines (pinus) and cash crops on the gentler slopes. Some of the areas are also currently under primary forest. By far the commonest crops are rubber and oil palm.
Distribution and Extent
The Rengam Series is probably the most widespread soil in Peninsular Malaysia. They occur in all states of the Peninsular except Perlis. To-date no soils similar to the Rengam Series have been mapped in Sabah or Sarawak.
Series Established
The Rengam Series was probably first established near the village of Simpang Rengam near Keluang in Johore. The source of name is Simpang Rengam Village, Johore, Peninsular Malaysia.
Remarks on Classification
The Rengam Series is classified here according to the Malaysian Soil Taxonomy – Second Approximation (Paramananthan 1998) as a member of the fine kaolinitic isohyperthermic red-yellow family of the Tipik Lutualemkuts. They are classified as soils having a deep kandic horizon which extends to a depth of 1.0 m without any significant decrease in clay with depth and with 35 to 60% clay and strong brown to brownish yellow colours. In the Keys to Soil Taxonomy – Eighth Edition (Soil Survey Staff 1998) the Rengam Series soils would be classified as Typic Kandiudults. In the FAO/ UNESCO Soil Map of the World – Revised Legend (FAO 1990) the Rengam Series would be classified as Haplic Nitisols.
Suitability for Agriculture
The soils of the Rengam Series are suitable for a wide range of crops. Terrain is the only limiting factor for this soil and the soil is prone to erosion on the steeper slopes. As such good soil conservation practices must be practiced on rolling, hilly and steep terrain. A proper fertilizer program is however essential in order to obtain good yields. The soils of the Rengam Series are suitable for a wide range of crops. Terrain is