Precision Farming: Concluding Remarks
[addw2p name=”precisionFarming”]
Precision farming is goal oriented and hinges on the advent of information technology, affordability of key technologies such as GPS, sensors and yield monitors, agronomic knowledge of the crop and management strategy and system. Its applicability for oil palm plantations also depends on the success of mechanisation of most field operations e.g. fertilisation, harvesting and collection, and the attitude and readiness of management to change.
Precision farming is a cropping system and therefore, we should not be too preoccupied with the technology but to listen to the management’s needs and devise, improve and match resources and agricultural practices with the soil and crop requirements for efficiency and high productivity. Precision farming also requires better and more progressive managers to implement and ensure its success.
Precision Farming: Future Work on Precision Farming for Oil Palm Plantations
[addw2p name=”precisionFarming”]
Precision farming has not been implemented in the oil palm plantations to the best of our knowledge although the tools and technologies associated with it have been widely utilised. The major obstacles to precision farming in oil palm plantations are probably capital expenditure, lack of quantification of cost-benefit and risk of the new practices and resistant to change, which can be expected at this early stage of development. Currently most of the research is on adapting the new tools and technologies to solve immediate problems with little thoughts given to strategic and tactical approaches. As pointed out by McBratney and Taylor (1999), “To make precision farming work all areas of the Precision Agriculture wheel (Figure 3) need to be addressed”.
We do not intend to provide a comprehensive account of the future work required to introduce precision farming successfully to the oil palm plantations as it is beyond us. Instead, it should suffice to list out some important areas where further research may be warranted.
Mechanisation of most operations (Figure 15) is an absolute necessity for precision farming to materialise in oil palm plantations. The machines will allow dataloggers, yield monitors, GPS, sensors etc to be fitted for data collection. However, the errors and precision of the data and generated yield maps need further investigation.
Figure 15: Examples of mechanisation of field operations in oil palm plantations

Differential GPS in the market are sufficiently accurate for geo-referencing in horizontal direction (< 5m accuracy is sufficient for oil palm plantations) but inadequate for vertical direction (currently accurate to 1-3m) and generation of good DEM for assessing among other, drainage requirement, terracing and re-direction of water into the fields (rain harvest and watershed management).
Agonomic research should be targeted on understanding yield variation at a finer scale than currently done. The results are important towards the success of attribute mapping and interpretation of yield maps, and development of decision support system (DSS). The former is confounded by the perennial nature of oil palm which exhibits strong temporal yield variation and 2 to 5 year yield cycle. Methods to combine spatial and temporal data (Blackmore, 2000) and a protocol to interpret yield maps (e.g. Larscheid et al ., 1997) should be develop for oil palm. Decision support system translates data into knowledge for differential actions in the fields generally by combining database, crop models, expert system and artificial intelligence. Work should commence on the next generation of DSS which will be web-based and accessible through hand-held equipment including a telephone.
Variable rate technology (VRT) is an engineering problem (McBratney and Taylor, 1999) but much research is still needed to make it work in oil palm plantations.
There is much scope for management improvement in precision farming particularly in increasing labour productivity via better infrastructure, more precise planning, organisation, budgeting and worker friendly practices (Chew, 1998). Ultimately, it is the management who will make precision farming in oil palm plantations a success or failure.
Precision Farming: Applicability of Precision Farming for Oil Palm Plantations
[addw2p name=”precisionFarming”]
The tools and technologies associated with precision farming have attracted the interest of researchers in the oil palm industry in Malaysia as illustrated by a number of recent papers such as Tey et al . (2000) on GIS, GPS and remote sensing, Goh et al. (1997) and Guha and Guha (1997) on decision support system, McMorrow et al. (2000) on remote sensing, Goh et al. (2000) on spatial FFB yield variation and Kok et al.(2000) on site-specific agronomic management. These tools and technologies provide an opportunity to understand and capitalise on the variabilities in the fields which have long been recognised by the planters but little can be done until now.
The existence of variabilities in oil palm plantations
Precision farming is only applicable if manageable variabilities exist in the fields. Two types of variability are of interest, namely, FFB yield which is the single most important factor influencing profit (Ong, 2000; Goh and Chew, 2000) and soil fertility which affects fertiliser input, the largest cost item.
a) FFB yields
The inherent palm to palm variability of FFB yield of oil palm has been studied via uniformity trials since the 1920s when it was first grown commercially. Its coefficient of variation (CV) could exceed 30% (Webster, 1938; Chapas, 1961; Goh and Alwi, 1988; Soh et al. , 1989). These CVs also vary from site to site and temporally (Goh and Alwi, 1988; Soh et al. , 1989). Part of the FFB yield variability could be attributed to soil heterogeneity where the Fairfield Smith’s heterogeneity index, “b”, commonly ranges from 0.25 to 0.93 (Goh and Alwi, 1988). Thus, Planters have demarcated their land into smaller management units or zones of 10 to 100 ha for more uniform fields and ease of implementing the agro-management practices.
However, the CV is non-spatial and does not distinguish between autocorrelated yield variation (which is manageable), and uncorrelated (‘nugget’) variation (which is not manageable) (McBratney et al. , 2000). This has prompted Goh et al. (2000b) to use geostatistical method to study the FFB yield variation in a fertiliser response trial of about 25 ha where FFB yields of individual palms were recorded. Results showed that the mean random (nugget) variation accounted for only 26% of the total variation (Table 2). About 74% of the FFB yield variation could be managed spatially if its causative factors are known.
Table 2: Semivariance analysis (standardised) of FFB yields of oil palm without N and K fertilisers from 1991 to 1998
| Parameter |
1991 |
1992 |
1993 |
1994 |
1995 |
1996 |
1997 |
1998 |
Mean |
| Total |
1.00 |
1.00 |
1.00 |
1.00 |
1.00 |
1.00 |
1.00 |
1.00 |
1.00 |
| Nugget |
0.23 |
0.28 |
0.28 |
0.28 |
0.22 |
0.27 |
0.28 |
0.22 |
0.26 |
| Spatial |
0.77 |
0.72 |
0.72 |
0.72 |
0.78 |
0.73 |
0.72 |
0.72 |
0.74 |
| Range (m) |
15 |
21 |
12 |
18 |
15 |
9 |
15 |
21 |
16 |
After Goh et al . (2000b)
b) Soils
Malaysian soils have generally low soil fertility and hence, large responses to fertilisers are commonly obtained in the oil palm plantations (Gohet al ., 1999). Apart from this, the soil nutrient contents vary considerably (CVs commonly exceed 40%) even within the same soil series as shown by Ng and Ratnasingam (1970) and Law and Tan (1977) for Peninsular Malaysia and Goh et al. (1998) for Sabah. Ng and Ratnasingam (1970) further showed large variations and spatial patterns of nutrient contents for individual soil types e.g. exchangeable K distribution (Figure 4) in a 11 ha field of Selangor series soil, which was derived from marine alluvium and considered to be fairly homogenous by soil profile examination (Chew, 1998). Their results indicated that two-third of the field would not require K fertiliser while the balance, mainly in the western halve, would need low K fertiliser rate to sustain growth and production.
Figure 4: Distribution of exchangeable K values (cmol(+)/kg soil) in 11 ha oil palm field of Selangor series soil (source: Ng and Ratnasingam, 1970)
Soil variations could also arise from previous planting practices such as fertiliser application areas, frond placement and harvesters path (Kee et al. , 1995; Goh et al ., 1996). Goh et al . (1996) also found high spatial variability within micro-sites of palm circles, frond piles and interrows within single palm areas from previous fertiliser application practices with resultant nutrient patches within 2 m of each other (Table 3). There are many other known sources of soil variation such as micro-relief and these will not be discussed in the paper.
Table 3: Score of nutrient patches around individual oil palms on Musang series (Typic Paleudult) soil
|
Soil depth |
Site |
Fertiliser |
|
|
Without |
With |
||
|
0-15 |
Palm circle |
8 |
12 |
|
Interrow |
8 |
6 |
|
|
Frond heap |
15 |
12 |
|
|
15-30 |
Palm circle |
12 |
12 |
|
Interrow |
7 |
6 |
|
|
Frond heap |
11 |
12 |
|
Note: Maximum score of 15 for best soil fertility and minimum score of 5 for poorest soil fertility
Source: Goh et al . (1996)
Tee (Unpublished) has studied the nature of soil NH4+ -N and NO3– -N in a long-term fertiliser response trial in Sabah, Malaysia where N fertiliser was applied in the palm circle (within 2 m radius of the palm). She found that the inherent soil NH4+ -N and NO3– -N i.e. in areas without nitrogen application for the past 10 years had higher CV compared to manured areas (Table 4). However, the CVs in the latter sites were still large with 45% for NH4+ -N and 81% for NO3– -N. But surprisingly almost all the variations were spatially related (Table 5) and therefore, manageable. The spatial ranges for NH4 + -N and NO3– -N were also substantially reduced with manuring. Interestingly, the spatial range for NH4+ -N in manured areas was 51.4 m, which was equivalent to 5 to 6 palm distance and corresponded well to the experimental plot size. Further work is necessary to ascertain and understand the results.
Table 4: Mean and variation of soil ammonium- and nitrate-N in the palm circle of oil palm on Kumansi Family soil in Malaysia
| Nitrogen | Nutrient |
Mean (mg/kg) |
CV (%) |
| Without |
NH 4 -N |
27.2 |
54.9 |
| With |
NH 4 -N |
140.9 |
44.8 |
| Without |
NO 3 -N |
7.5 |
102.5 |
| With |
NO 3 -N |
9.7 |
80.5 |
Note: CV denotes coefficient of variation
After Tee (Unpublished)
Table 5: Nature of variations of soil ammonium- and nitrate-N in the palm circle of oil palm on Kumansi Family soil in Malaysia
| Nitrogen | Nutrient |
Total Variation |
Random |
Spatial |
Range (m) |
| Without |
NH 4 -N |
2.44 |
0.18 |
2.26 |
254.3 |
| With |
NH 4 -N |
1.06 |
0.09 |
0.97 |
51.4 |
| Without |
NO 3 -N |
1.23 |
0 |
1.23 |
71.6 |
| With |
NO 3 -N |
1.02 |
0.06 |
0.96 |
19 |
After Tee (Unpublished)
Maximising FFB yields
The major factors affecting oil palm yield are known and their effects have been quantified by various researchers such as Foster et al . (1985) and Kee et al .( 1994). Goh et al. (2000a) presented an outline of an empirical model called ASYP, which has been validated (Kee et al ., 1994; Kee et al ., 1999) and used commercially as shown in Figure 5. The model predicted that site yield potential of a field is more or less predetermined after planting. Very little can be done to change the variable factors such as planting density and pattern till replanting more than 20 years later (Chew, 1998). Uneven planting with over-crowded spacing or high vacancies particularly in hilly, rugged terrain (Figure 6) can result in poor uniformity of growth, light utilisation and exploitation of soil nutrients and water for maximum production. This common problem provides an excellent opportunity for precision farming by making full use of remote sensing and digital elevation model (DEM) to demarcate the terrain as shown in Figure 7 and coupled with soil maps for specific practices such as higher planting density for peat soil (160 palms per ha) and shallower soils (148 palms per ha). We can also automatically generate precise positions of the terraces for constant density planting in hilly areas as illustrated in Figure 8 (Tey et al ., 2000). The latter has always been a Planter’s dream but could be a reality now with the new tools and technologies.
Figure 5: Primary factors influencing the site yield potential of oil palm in Malaysia

Source: Goh et al. (2000a)
Figure 6: Ikonos remote sensing image (1 m resolution) shows areas with large vacancies and uneven plantings.
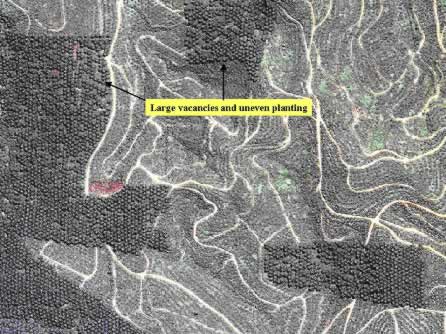
Source: Space Imaging Inc., Singapore.
Figure 7: A 5 meter-pixel slope map derived from the DEM of the study area allows the demarcation of field by terrain.
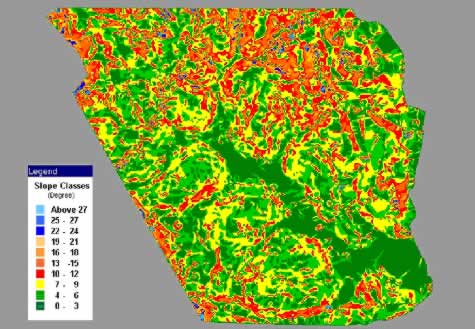
Source: Tey et al . (2000)
Figure 8: Using DEM and slope map to automatically generate the proposed terraces for constant density planting in oil palm plantation
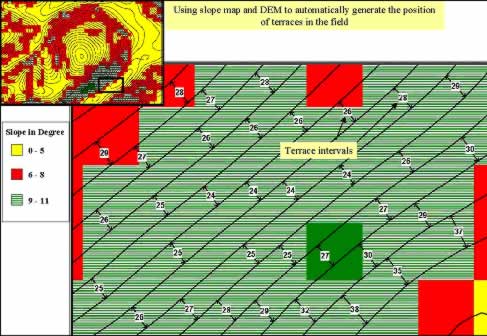
Source: Tey et al . (2000)
The soil factors in the production equation of oil palm (Figure 5) could be easily determined by detailed soil survey (Goh et al ., 1997). This traditional process is essential for maximising FFB yields because the different marginal and problem soils in the oil palm plantations would require separate management strategies and agricultural practices (Goh and Chew, 1995) as shown in Figure 9. Of more importance is perhaps the identification of specific, main soil and agronomic limiting factors (e.g. shallow, lateritic soils) and reclassification of common soils in each field into practical management zones that are bordered by roads and precisely located in GPS maps for ease of implementing the prescribed remedial actions (Figure 9). The impact of site-specific management was demonstrated by Goh et al. (1997) in a semi-commercial trial where each field was separated into lateritic and non-lateritic areas in 1986 (Table 6). The overall FFB yield of the 216-ha area increased from 18.4 t/ha/yr in the period of 1984-86 where uniform management was practised to 26.3 t/ha/yr in 1990-92 after implementation of site-specific inputs from 1986 (Kok et al ., 2000). At palm oil price of RM 1000/tonne, profit per hectare was 35% better in the period after site-specific management (Goh et al ., 1997).
Figure 9: Creation of practical management zones for site-specific agricultural practices 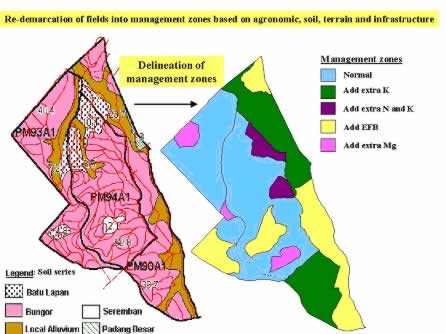
Adapted from Kok et al. (2000)
Table 6: Effect of improved agromanagement inputs and site-specific management on FFB yields
|
Details of site |
FFB yield (t/ha/yr) |
||||
| Field | Soil type |
Site yield potential (t/ha/yr) |
Period 1
|
Period 2 |
Period 3 |
| PM81A | Non-lateritic |
32.6 |
19.6 |
30.1 |
32.4 |
| PM81B | Non-lateritic |
28.6 |
15.8 |
26.7 |
28.0 |
| PM82 | Non-lateritic |
30.1 |
17.3 |
33.0 |
32.8 |
| PM77 | Non-lateritic |
30.2 |
19.3 |
29.3 |
28.0 |
| PM72 | Non-lateritic |
27.0 |
19.0 |
25.0 |
25.0 |
| Weighted mean |
28.6 |
18.4 |
27.9 |
27.6 |
|
| PM81A | Lateritic |
26.8 |
19.6 |
25.1 |
30.6 |
| PM81B | Lateritic |
23.4 |
15.8 |
22.5 |
25.8 |
| PM82 | Lateritic |
26.7 |
17.3 |
25.2 |
28.0 |
| PM77 | Lateritic |
25.6 |
19.3 |
24.0 |
25.4 |
| PM72 | Lateritic |
23.1 |
19.0 |
21.7 |
22.9 |
| Weighted mean |
24.4 |
18.4 |
23.0 |
25.1 |
|
Note: Uniform management of each field in period 1. Site yield potential of each site was estimated using ASYP model in 1986.
After Goh et al. (1997)
The management zones can be further delineated if FFB yield maps are available as shown in Figure 10. Even in a relatively uniform field with similar management practices, there are distinct areas of high and low yielding palms, e.g. a patch of low yielding palms in the lower right-hand corner of Figure 10a and western corner of Figure 10b.
Figure 10: FFB yield maps of oil palm in 2 different sections of a relatively uniform field
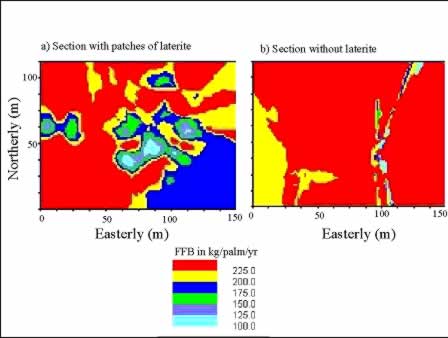
Source: Tee (Unpublished)
Quick identification of problems and nipping them in the buds are key steps towards maximising FFB yields in the plantations. Two examples are provided in the paper. Firstly, we have used GIS and GPS to improve drainage in an estate (Tey and Chew, 1997). This problem requires an overview of the watershed on a regional basis which is commonly beyond the estate boundary and covers land owners. With the new tools, we can easily compute the volume of excess water to drain, determine the direction of main drain, design a system of collection and field drains and compartmentalise areas for specific drainage design (Figure 11).
Figure 11: Design of drainage system in an oil palm plantation using GIS, GPS and DEM
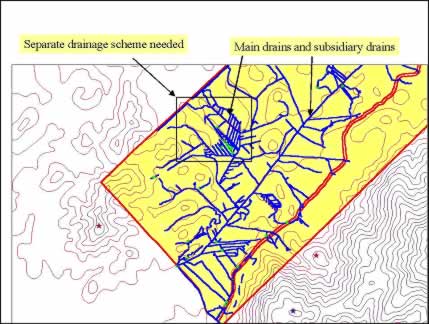
Adapted from Tey and Chew (1997)
Another example is the assessment of the extent and progress of pest damage in an oil palm plantation using remote sensing images (Figure 12) where the ability to survey affected areas quickly is a big advantage in pest and disease management (Chew, 1998). We can also identify the direction of the pest movement, which is easterly in the example, and the focal points where the next outbreak is likely to occur. This allows for differential treatments and timing of treatments to contain and ultimately eradicate the pest.
Figure 12: Quick assessment of pest damage and movement using remote sensing image
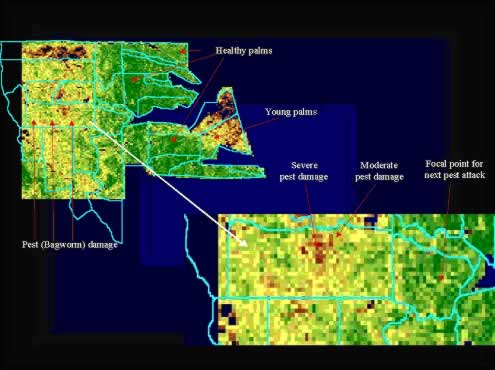
Adapted from McMorrow and Tey (2000)
Optimising inputs through precise actions
a) Management zone
The current technologies, information and management level at the oil palm plantation do not allow the precise management of single oil palm. Therefore, creation of management zones within the plantation based on palm age, agronomic and soil information and infrastructure is still the most effective means to optimise inputs as discussed earlier. The difficulty here is to decide on the scale or size of each management zone, which is probably too big now at 10 to 100 ha. Early work shows that the spatial variation of FFB yield is isotropic with a range of about 3 palm distance (Goh et al ., 2000b). This means that the optimum size of a management zone is 32 palms given the triangular spacing in oil palm planting. But with the common road spacing of 20 palm distance, the minimum, practical management size should be 140 palms (7 palm rows x 20 palms per row) or about 1 ha. Further work is needed to ascertain this.
b) Fertilisation
The principal agronomic constraint to high productivity is usually inadequate soil nutrient supply (Chew, 1998), which is corrected by large amount of fertilisers. Thus, fertiliser is the largest cost item in the production of oil palm in Malaysia. It constitutes about 60 – 70% of the field upkeep cost of oil palm. Chew (1998) further contended that “Wrong fertilisation techniques may result in high financial losses through loss of crop or excessive fertilisation and risks of high nutrient losses in run-off, leaching and other nutrient loss mechanisms”. Precision farming appears to offer some solutions to the problem.
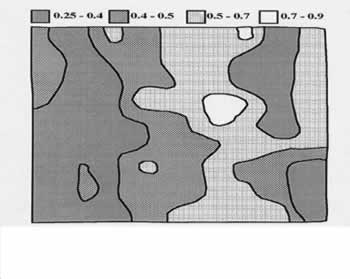
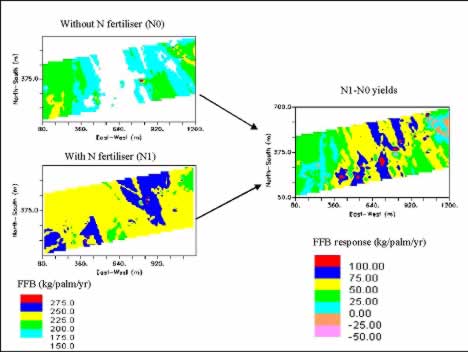
Classical fertiliser response trials on different soil types showed highly variable FFB yield responses to N, P and K fertilisers, ranging from 0 to over 100 %. These variations could be partially reduced with management zoning of the fields and correct fertilisation (Goh et al. , 1999). However, the real opportunity to optimise fertiliser inputs lies in the understanding of the large variation in fertiliser responses within the same soil series and similar terrain as shown in Table 7. In a first attempt, we have used the plots with and without nitrogen applications in a classical fertiliser response trial (about 25 ha) as sampling points for generation of yield maps by kriging. Results showed that the yield response to nitrogen varied spatially across the trial site (Figure 13). They ranged from good FFB yield response of more than 50 kg/palm/yr in the central portion of the field to poor or negative response in the eastern and western parts. These results might be partially explained by the localised high soil N contents and the presence of a thin layer of laterites in the central portion which hinders root development leading to higher N response. This study indicates that differential N input is probably more cost effective and environment friendly.
Table 7: FFB yield responses to 1 kg Ammonium sulphate (AS) applied per palm per year and corresponding yield levels at non-limiting rates of all other fertilisers in trials on some sedentary soils in Malaysia
| Soil series |
N1 response (t/ha/yr FFB) |
N1 yield |
N2 response (t/ha/yr FFB) |
N2 yield |
| Batu Anam |
0.53 |
28.06 |
0.68 |
29.57 |
| Batu Anam |
1.46 |
22.39 |
1.78 |
26.41 |
| Batu Anam |
2.56 |
18.14 |
1.24 |
22.85 |
| Batu Anam |
2.40 |
17.53 |
1.49 |
21.44 |
| Munchong |
1.33 |
23.70 |
0.47 |
24.60 |
| Munchong |
1.02 |
30.40 |
0.46 |
32.13 |
| Munchong |
-0.65 |
27.59 |
-0.75 |
25.40 |
| Munchong |
0.54 |
25.95 |
0.43 |
27.09 |
| Rengam |
1.38 |
25.03 |
0.72 |
27.39 |
| Rengam |
3.46 |
23.81 |
1.22 |
29.08 |
| Rengam |
-0.88 |
23.04 |
-1.35 |
22.28 |
| Rengam |
1.92 |
24.31 |
0.98 |
29.59 |
| Rengam |
0.78 |
26.49 |
0.56 |
27.70 |
| Rengam |
0.82 |
27.19 |
0.64 |
28.50 |
Source: Chew (1998) who adapted it from Foster et al . (1985)
Figure 13: Spatial FFB yield response of oil palm on Kumansi Family soil to N fertilisers
Apart from getting the fertiliser rates right and applying them in the correct places, timing of fertiliser applications holds the most promise for improving efficiency. This is because run-off and soil erosion are the most important pathways for soil and fertiliser nutrient losses. Both processes are driven by rainfall which is difficult to predict in the tropics. However, using expert system and artificial intelligience we have developed a package which predicts the best months to apply fertilisers taking into account the fertiliser properties, agronomic data such as palm age and nutritional status, soil data such as terrain and consistency, management resources, risk management and weather. The present management system including the size of fertiliser store generally does not allow the applications of different fertilisers in different fields in the same month or to apply the fertilisers for each field in the few best months available (problem with labour resource allocation) unless fertiliser applications are fully mechanised. Hence, the program also compares the predicted best months to apply fertilisers with the actual recommended months of applications to determine the potential loss in fertiliser efficiency (Table 8) which can be corrected with higher fertiliser rates, albeit at a “financial loss”.
Table 8: Scheduling of fertilisers for the oil palm plantations using expert system
| Manuring Block | Month/yr | Fertiliser type |
Rate (kg/palm) |
Suitability of month | Remarks |
| 1 PR97A 2 | Jul-98 | AS |
0.75 |
Good | – |
| Aug-98 | AA2 |
1.00 |
Fair | Maximum rate | |
| Sep-98 | KS |
1.25 |
Poor | – | |
| Nov-98 | AA2 |
1.00 |
Poor | Maximum rate | |
| Dec-98 | JRP |
3.50 |
Poor | – | |
| Jun-99 | MOP |
1.25 |
Good | – | |
| 1 PR97A 3 | Jul-98 | AS |
0.75 |
Good | – |
| Aug-98 | AA2 |
1.00 |
Fair | Maximum rate | |
| Sep-98 | JRP |
3.50 |
Poor | – | |
| Nov-98 | AA2 |
1.00 |
Poor | Maximum rate | |
| Jun-99 | MOP |
1.25 |
Good | – |
c) Infrastructure
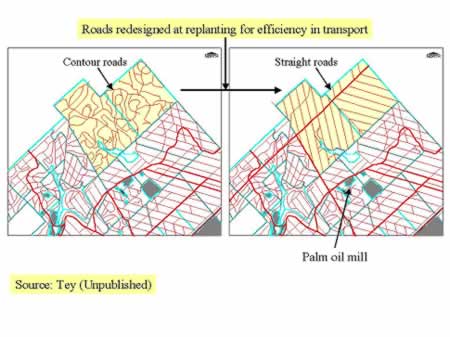
In a good oil palm plantation of 2000 ha, there are approximately 200 km of roads to transport about 50000 tonne of FFB to the mill each year. DEM coupled with decision theory such as shortest path and network with constraints e.g. setting maximum slope of the road at 10% can be used to re-design the road system for more efficient transport of FFB to the mill as shown in Figure 14 (Tey, Unpublished).
Figure 14: Redesigning road system in an oil palm plantation using DEM for efficient transport of FFB, workers etc
Identify areas for replanting and planting
Emmott et al . (1997) stated that “If replanting is a key issue in plantation crops, then identifying where yield improvements can be achieved in order to realise a satisfactory return on investment might be appropriate area for precision farming”. This is probably true in Peninsular Malaysia where the oil palm is getting older and probably past its prime productivity due to management difficulty in maintaining sufficient leaf area index (Goh and Chew, 2000), harvesting standards and collection of loose fruits. The potential yield loss could be examined by comparing the actual yield obtained from the field against its site yield potential, which can be estimated using ASYP model as discussed earlier. The yield gaps may then be classified and displayed on GPS maps to form a basis for strategic decision (trade-off) on replanting program of the company rather than to use an arbitrary yield level such as below 18 t/ha/yr which varies with the palm oil price or at palm age of say 25 years old (Goh et al ., 2000).
Similar approach can be taken to decide on planting or land conversion to oil palm and avoid unsuitable areas such as steep hills and swamps (Goh et al ., 1997).
Monitoring and assessment of results
One of the cornerstones of precision farming is to precisely monitor and assess the agricultural enterprise at a local and farm level (Blackmore, 1994). The oil palm industry has religiously collected agronomic and management data at the field level where possible. However, to quote Gohet al . (1999) “Of late, there is a discernible move towards larger manuring blocks in the estates with many of them exceeding 100 ha. The main reasons for this are unknown although the undertone is that management will be easier especially for large estates. Such practice, which is a form of sweeping generalisation, is definitely wrong and will make a mockery out of fertiliser management. It can also easily negate the huge investments in cost, time, manpower and equipment in the preparation of precise fertiliser recommendations”. Similarly, yield data are being combined from many fields rendering them almost useless for assessment purposes. This need not happen if we use remote sensing, GIS, GPS and electronic gadgets such as Palm organisers to collect data digitally at the estate level and adapt information technology such as decision support system to store and collate data and report the results at appropriate scales for the management.
Accurate and precise maps and area of each field are essential because most productivity figures for assessment of results and performances are based on per area (hectare) basis. In the absence of expensive land surveys, GPS and GIS mapping can provide precise field sizes apart from road, soil and terrain maps (Chew, 1998). Chew (1998) also reported that errors in hectareage commonly exceeded 10% in the plantations (Table 9).
Table 9: Differences in declared hectareages in individual blocks in oil palm plantations after GPS mapping
| Estate | Area (Ha) |
Total number of blocks |
Ha difference (%) |
||||
|
< 2 |
2-5 |
6-9 |
10-15 |
>15 |
|||
| 1 |
639 |
7 |
1 |
– |
– |
5 |
1 |
| 2 |
864 |
38 |
1 |
2 |
6 |
5 |
24 |
| 3 |
974 |
16 |
3 |
7 |
3 |
2 |
1 |
| 4 |
811 |
27 |
3 |
3 |
4 |
9 |
8 |
Source: Chew (1998)
Yields in the plantations are usually estimated from bunch count numbers and average bunch weight for the fields. The number of bunches from each task (usually 1-2 ha) or platform can be recorded using a Palm organiser such as PalmPilot and electronically transferred to the database to compute harvester and field productivity quickly. Yield maps can also be generated for the purposes discussed above. With in-field mechanisation and collection of FFB, the prospects for more precise yield monitoring at finer scale are good (Chew, 1998) and should be encouraged.
Precision Farming: What is Precision Farming
[addw2p name=”precisionFarming”]
“Precision farming” is the new term coined for farming practices which were variously described as “prescription farming”, “site-specific” practices, “variable rate technology” etc previously (Chew, 1998). Notwithstanding the many connotations, the basic philosophy of precision farming is to measure and manage variabilities such as yield, soil, pest and weed across the fields (Larscheid et al. , 1997) in order to enhance efficiency in the management of agricultural practices in the cropping system for optimum productivity, product quality and economic returns, and minimise environmental impact and agricultural risk. It therefore prescribes applications of what are only required to achieve the particular goal(s) at various distinct points or sites (Chew, 1998) in sufficiently fine scale in the fields. It capitalises on the advent in information technology and engineering to attain its objectives.
The five core components or processes of precision farming (Blackmore and Larscheid, 1997) are:
- Measuring variability
- Analysing variability
- Decision-making
- Differential actions
- Assessment of results
Measuring and analysing variability form the keystones of precision farming. They attempt to establish the permanent field characteristics that influence production and yield maps for as many years as possible (Blackmore and Larscheid, 1997). These characteristics or factors are recorded at precise locations over time to enable the study of spatial and temporal variabilities. The existence of these variabilities particularly yield and the understanding of them provide an opportunity for precision farming. In fact, if they do not exist then a uniform management system is both the cheapest and most effective management strategy and precision farming is redundant (McBratney and Taylor, 1999). In analysing variability, it is common to produce maps which show spatial trend, stability of the spatial characteristics such as yield and management (classified) zones for similar inputs.
Recording spatial data and plotting maps will be meaningless unless we can quickly retrieve the data and translate them into information and knowledge for use in improving the production system. This falls into the area of a decision support system (Goh et al. , 1997) which can incorporate inter alia crop models, artificial intelligence, data mining tools and information technology to examine whether variable actions in specific areas of the fields are warranted, match the local resources and agronomic practices with the soil properties, crop requirements etc and develop different strategies from the data for the management to choose and implement in the fields. However, it should be appreciated that not all variabilities can be managed efficiently or economically because they depend very much on the nature and magnitude of the variabilities (McBratney and Taylor, 1999).
The availability of geographical information system (GIS) and global positioning system (GPS) has enabled the quick production of maps for the management to locate the problem areas precisely in the fields for differential treatments. Variable rate applicators, machinery and technology have been used in many crops such as rice, wheat, corn, soybean and other crops to apply the prescribed treatments at each site (Chew, 1998). As the costs of equipment and technology decrease, this practice will eventually become available to farmers with low value or non-strategic crops like oil palm.
It is a wise management principle to always monitor and assess the results of agricultural practices against the tactical or strategic objectives and goals of the cropping system for further actions and if necessary, the whole processes of precision farming may repeat themself. In fact, McBratney and Taylor (1999) have conceptualised the above processes for a site-specific management system as a Precision Agriculture wheel as shown in Figure 3. They also point out that precision farming is a wheel and without one of the cogs it will not succeed.
Figure 3: The Precision Agriculture wheel: Components of a site-specific crop management (SSCM) system

Source: McBratney and Taylor (1999)
The philosophy and processes of precision farming have been made possible by the advent and recent affordability of several key technologies (Chew, 1998) such as:
- Personal computers
- GPS technology which reads signals continuously available from satellites enabling near pin-point horizontal and vertical accuracy
- Remote sensing where satellite and aerial images are processed and correlated to crop characteristics
- GIS technology which manages and displays spatial data and relationships
- Variable rate application equipment with sensors and GPS to respond to field and soil variables.
Apart from hardware, the development in information technology is also essential towards the success of precision farming. The technology is needed to control the sensors for variable rate application, datalogging and transforming data into knowledge as discussed earlier.
It is increasingly recognised that precision farming is a cropping system and therefore, cannot be separated from the management system and philosophy of the farm. This is because precision farming involves capital expenditure, re-training of personnel including workers, and human perception and acceptance of new practices. McBratney and Taylor (1999) state that the concepts of Total Quality Management (TQM) and Vertical Integration (VI) in the agricultural sector are central to the precision farming philosophy. They further contend that “a farmer is concerned not only with quality at the farm gate but also the quality at the point of sale and how his product meets consumer demands. This will bring premiums and also will probably be used for environmental auditing”.
With the potential benefits, it is not surprising that interest in precision farming is now sweeping the world with many research centers being set-up to advance the technologies and introduce them to the local farming systems. Can we learn from them and apply these new tools to our advantage in the oil palm plantations?
Oil Palm: Precision Farming
[addw2p name=”precisionFarming”]
The oil palm, Elaeis guineensis, Jacq ., is a perennial tree which is extensively planted as a monoculture crop in the plantations. It was introduced into Malaysia in the late 19th century but its phenomenal growth commenced only in the mid-sixties under the crop diversification plan. From 97000 ha in 1965, the oil palm areas have increased to about 3.3 million ha in 1999 (MPOB, 2000). The annual export revenue of oil palm at about RM 18 billion between 1997 and 1999 has brought much relieve to the nation during the recent financial crisis.
However, the substantial increase in oil palm areas has not been commensurate by its productivity in terms of yield per ha. The national fresh fruit bunch (FFB) yields have stagnated at a relatively low level of 18.7 t/ha/yr (Table 1). Similar trend was obtained by the major plantation groups with annual FFB yields fluctuating between 20 and 22 t/ha/yr since 1989 (Figure 1). These yields also fell short of their site yield potentials based on experimental results. The dismal yield performances have been attributed to many factors, among them are generalised agricultural inputs and monitoring, increased field size or management unit, declining management standards, lack of skilled workers and poor understanding of agronomy, but probably also exacerbated by the planting of oil palm on soil and climatic conditions previously deemed as marginal or unsuitable and the replanting of the rubber and cocoa on hilly, poor soils to oil palm.
Table 1: Mean yield of fresh fruit bunches (FFB), crude palm oil and palm kernels in Malaysia 1975-1997
|
Year |
FFB yield (t/ha/yr) |
Crude palm oil (t/ha/yr) |
Palm kernels (t/ha/yr) |
|
1975 |
17.95 |
3.66 |
0.74 |
|
1976 |
16.16 |
3.48 |
0.71 |
|
1977 |
16.32 |
3.54 |
0.74 |
|
1978 |
16.25 |
2.95 |
0.68 |
|
1979 |
17.76 |
3.65 |
0.79 |
|
1980 |
18.72 |
3.78 |
0.81 |
|
1981 |
19.16 |
3.76 |
0.79 |
|
1982 |
19.50 |
3.83 |
0.80 |
|
1983 |
17.45 |
3.43 |
0.72 |
|
1984 |
21.80 |
4.25 |
1.19 |
|
1985 |
22.15 |
4.33 |
1.28 |
|
1986 |
22.15 |
4.41 |
1.28 |
|
1987 |
17.10 |
3.39 |
1.01 |
|
1988 |
17.52 |
3.47 |
1.04 |
|
1989 |
19.57 |
3.88 |
1.15 |
|
1990 |
18.53 |
3.64 |
1.10 |
|
1991 |
17.85 |
3.48 |
1.01 |
|
1992 |
17.83 |
3.43 |
0.99 |
|
1993 |
20.26 |
3.78 |
1.16 |
|
1994 |
18.42 |
3.43 |
1.05 |
|
1995 |
18.93 |
3.51 |
1.06 |
|
1996 |
18.95 |
3.55 |
1.06 |
|
1997 |
19.10 |
3.63 |
1.06 |
|
Mean |
18.67 |
3.66 |
0.97 |
Figure 1: Mean FFB yields and production costs of some major plantation groups in Malaysia from 1989 to 1997.

Apart from the above, the oil palm industry also faces two disconcerting scenarios: the excalating production costs since 1994 (Figure 1) and the decreasing real price trend of palm oil since 1950s (Figure 2). The likely consequence is a gradual dilution of profits in the long-term which can lead to the non-sustainability of the oil palm plantations. Since the palm oil price is generally beyond the control of the industry, we shall need to manage the production costs within acceptable limit to maintain sufficient returns to investment. The best avenues to achieve this in the labour intensive plantation business where wages have a strong influence on the production costs, are probably reducing labour requirement and raising FFB yields. In fact, it has been shown that a 1% increase in FFB yield will reduce the production costs by 0.8 to 1% (Ong, 2000; Goh and Chew, 2000).
Figure 2: Real price trend of palm oil since 1950

Source: Fry (1998)
Traditionally, the oil palm plantations have relied on large-scale extensive agricultural practices, improvement in planting materials and good management, which have served us so well in the past, to increase productivity. However, they now seem to offer few scopes for alleviating the above grave scenarios and closing the perceived large yield gaps seen in the industry over the past two decades. Therefore, as stated by Chew (1998), “It appears inevitable that we shall have to intensify and improve our planting practices by developing new techniques to increase efficiency and productivity to keep ahead of our competitors and maintain our reputation as a responsible green industry”. This strategy or approach falls within the realm of precision farming as discussed below.
This paper will attempt to provide a brief overview of precision farming, preliminary assessments of the applicability of precision farming for oil palm plantations and future work on precision farming for oil palm plantations.
Reference
Goh, K.J., Tee, B.H. and Anuar, A.R. (2000) Applicabilitity of precision farming for oil palm plantations in Malaysia. In: Seminar on Precision Farming. 16 October 2000, Universiti Pertanian Malaysia and Agricultural Institute of Malaysia, Serdang: Preprint.
Note: The full list of references quoted in this article is available from the above paper.