Coconut: Planting
COMMERCIAL COCONUTS AND COCOA PLANTINGS ON ACID SULPHATE SOILS
Young Coconuts
There are no young MAWA coconut areas in our group on acid sulphate soils. However, 133 ha of MAWA hybrids were replanted in Estate 1 following rubber in 1980 and 1981 on Briah/Java/Sedu series soils. At the commencement of field preparation, the detailed soil maps were not yet available and following soil pH tests which showed values below pH 3.6 and 4.1 in the top 15 cm, the areas were treated as potentially acid sulphate and field preparations made accordingly. A brief description of the planting practices adopted is given:-
• Land preparation and drainage. The old rubber was poisoned, felled and burnt. These precautions were taken to minimise rhinoceros beetle problems.
The cleared land was ploughed and harrowed for weed control, to fit new uniform drainage schemes and to level the areas. The practice is useful for mechanization in future and also to benefit the legume growth by reducing initial weed competition.
New drains were then dug at the specifications decided, usually 1 m (width) x 1 m (depth) x 0.5 m (bottom width) at every fourth palm row.
The management was encouraged to practise water management by keeping the water table at 75 cm depth where possible by using weirs in the drains.
• Planting practices. Standard polybag nursery practices i.e. using 45 cm x 50 cm size polybags, fertilizer schedule (Appendix 2) and daily watering were adopted with satisfactory growth. Top soil was used to fill the bags.
APPENDIX 2. FERTILISER SCHEDULE FOR MAWA COCONUTS IN POLYBAG NURSERY
|
Months after planting |
CIRP |
CCM25 (kg/bag) |
|
Bag filling |
Mix 200g/bag (45 cm x 50 cm x 500 gauge) thoroughly |
|
|
1 |
5 g |
|
|
2 |
10 g |
|
|
3 |
15 g |
|
|
5 |
20 g |
|
|
7 |
40 g |
|
|
9 |
40 g |
Leguminous covers were planted in these areas. Again, standard techniques were used although in the acid sulphate areas, liming at 2.5 to 5.0 tons per ha was suggested with apparently beneficial effects to the legumes. Difficulty in establishing and maintaining the legumes in these areas was experienced due to abnormal flooding and probably high acidity. Results obtained usually were legume/grass mixtures.
Normal ring weeding of the palms was carried out to minimise weed competition with the palms.
• Fertiliser application. The fertilizer schedules followed in the acid sulphate areas are given in Appendix 3.
APPENDIX 3. SUGGESTED FERTILISER SCHEDULES (KG/PALM) FOR HIGH YIELDING HYBRID COCONUTS ON ACID SULPHATE SOILS (CHEW, 1982)
| Year |
Linau-Sedu Ass. |
||||
|
CCM 77 |
Urea |
CIRP |
M.Potash |
Mg. Limestone |
|
| 1 |
1.00 |
– |
0.75 |
– |
3.0 |
| 2 |
– |
0.75 |
1.00 |
1.25 |
– |
| 3 |
– |
1.50 |
1.50 |
2.00 |
3.0 |
| 4 |
– |
1.50 |
1.50 |
1.50 |
– |
| 5 |
– |
1.25 |
– |
1.25 |
– |
| 6 |
– |
1.25 |
– |
1.25 |
– |
| 7 |
– |
1.25 |
– |
1.25 |
– |
| 8 |
– |
1.25 |
– |
1.25 |
– |
The high rates are to ensure good early establishment and precocious yields for which the MAWAs are famous.
The early growth of the planted MAWAs appeared satisfactory. Only problems were damage by rhinoceros beetles.
Old Coconuts
The policy in all coconut areas is to intercrop with cocoa to maximize profits. Most of the coconut areas on the acid sulphate soils are (>25 yrs) and were planted with a mixture of dwarfs, natural hybrids in 1954/55, at close density for dwarf palms (approx. 6.7 m). Planting practices in these areas are discussed and compared with similar coconut palms planted on non-acid sulphate soils (Sabrang and Briah series) in Estate 2 probably from the same seed palms as Estate 1 and dwarf palms on comparable age in another non-acid sulphate soil (Bernam/Selangor series) in Estate 3.
• Planting practices. All areas are inter-cropped with cocoa. As this was carried out over a period of years from 1968 and with some considerable conflicting views, planting density and spacings of the cocoa varied considerably but were usually very dense at 750 to 1100 bushes per ha initially and recently thinned down to 530 to 750 bushes per ha.
The ground cover is usually bare of vegetation in view of the dense shade of the cocoa and coconuts and also the deliberate policy of the management to keep out all ground vegetation.
Coconut husks, after removing the nut, which used to be burnt in pre-cocoa planting days are now usually left scattered in heaps in the interrows.
• Water management. This is stressed in the acid sulphate areas in view of the need for adequate drainage with cocoa planted in the areas and also the potential dangers of higher acidity developing in the soil on over-drainage. Water tables in the acid sulphate areas fluctuated from 0.3 m to 1.2 m but were mostly 0.6 m to 0.9 m.
Often however, with the seasonal rainfall of the estates, excessive water or absence of it was the problem and largely outwith the control of the management.
• Nutrition. The coconuts were fertilized sparingly as seen in Table 3.
TABLE 3. NUTRIENTS (KG/PALM) APPLIED TO COMMERCIAL COCONUT AREAS (1974 TO 1982)
| Est. | No.of fields | Soils | No. of years applied |
Nutrients (kg/palm) |
||||||
|
N |
P205 |
K20 |
Mg0 |
Limestone | ||||||
| 1 | 4 | Acid Sulphate areas (81% Sedu Series, 1.2% Guar Series) | 5-8 | Mean |
1.68 |
0.51 |
0.28 |
1.79 |
13.4 |
|
| Range |
1.34-2.12 |
0.33-0.68 |
nil-0.82 |
1.38-2.11 |
9-18 |
|||||
| 1 | 4 |
Less Acid Sulphate Areas (44% Sedu Series, 27% Selangor Series, 13% Java Series) |
5-6 | Mean |
1.28 |
0.33 |
0.24 |
1.29 |
13.2 |
|
| Range |
1.08-1.34 |
0.33 |
nil-0.41 |
1.0-1.76 |
7-16 |
|||||
| 2 | 4 | Sabrang and Briah Series | 5-7 | Mean |
1.63 |
0.48 |
0.34 |
nil |
nil |
|
| Range |
1.06-2.00 |
0.43-0.59 |
nil-0.82 |
nil |
nil |
|||||
| 3 | 3 | Bernam/Selangor Series | 8 | Mean |
2.57 |
0.36 |
0.63 |
nil |
nil |
|
| Range |
2.43-2.74 |
0.36 |
0.41-0.95 |
nil |
nil |
|||||
Fertiliser rates are drawn up on available general information of the nutrient requirements of the palms, leaf and soil analysis results and the fertilizer application made to the cocoa, nutrient requirements of the latter and expected profitability of fertilizer applications made.
Only magnesium applications as magnesium limestone and calcium limestone application were applied at high rates in the acid sulphate areas.
The other feature in the fertilizers applied is the higher nitrogen and potassium application on the Bernam/Selangor series areas. This is in view of the expected responses to nitrogen and the lower leaf K levels.
Applications were withdrawn in the last two years on very low copra prices.
Leaf and soil analysis data on the acid sulphate areas are given in Table 4 and 5 and compared to non-acid sulphate areas.
| Est. | Soils |
No.of yearsanalysed |
Frond 14 (% on d.m.) |
||||
|
N |
P |
K |
Mg |
Ca |
|||
| 1 | Acid sulphate areas (81% Sedu Series, 12% Guar Series) |
10 |
1.90-1.95 |
.125-.131 |
.84-.97 |
.23-.25 |
.14-.19 |
| 1 | Less Acid Sulphate areas (44% Sedu Series, 27% Selangor Series, 13% Java Series) |
10 |
1.90-1.93 |
.130-.135 |
.81-.89 |
.18-.34 |
.15-.20 |
| 2 | Sabrang and Briah Series |
9 |
1.88-1.90 |
.128-.133 |
.76-.84 |
.33-.38 |
.18-.21 |
| 3 | Bernam/Selangor Series |
10 |
1.80-1.82 |
.135-.137 |
.57-.61 |
.44-.45 |
.18-.19 |
The soil analysis results given for individual fields in the coconut areas discussed are for fertilized areas in the cocoa interrow areas and mainly unfertilized areas (except for limestone) between the coconut palms.
Soil pH results (air-dry soil) of topsoil samples after 1980 are above four units in all cases. Earlier analysis showed lower pH in the acid sulphate areas but these were subsequently corrected by liming.
Organic carbon, nitrogen and phosphorus contents are higher on the Sedu series than on Bernam series but have lower base cations. Limited analysis results are available for the Sabrang and Briah series areas. Their soil nutrient contents for available P and the exchangeable cations appear similar to the Bernam series.
Nutrients applied to the cocoa are shown in Table 6.
TABLE 6. NUTRIENTS (KG/BUSH) APPLIED TO COCOA AREAS (1976-1982)
| Est. | Soils |
No.of years applied |
Nutrients (kg/bush) |
|||||
|
N |
P205 |
K20 |
Mg0 |
Limestone |
||||
| 1 | Acid Sulphate areas (81% Sedu Series, 1.2% Guar Series) | 7 | Mean |
.43 |
.36 |
.49 |
.09 |
7.21 |
| Range |
.28-.51 |
.11-1.01 |
.40-.55 |
.05-.10 |
6.0-8.4 |
|||
| 1 |
Less Acid Sulphate Areas (44% Sedu Series, 27% Selangor Series, 13% Java Series) |
7 | Mean |
.45 |
.11 |
.55 |
.08 |
6.5 |
| Range |
.35-.63 |
.06-.18 |
.46-.71 |
.05-.10 |
4.8-9.0 |
|||
| 2 | Sabrang and Briah Series | 7 | Mean |
.58 |
.25 |
.52 |
nil |
5.7 |
| Range |
.43-.63 |
.22-.27 |
.42-.58 |
nil |
5.3-6.0 |
|||
| 3 | Bernam/Selangor Series | 7 | Range |
.64 |
.15 |
.44 |
nil |
1.1 |
High limestone applications were again made in the acid sulphate areas. Applications of nitrogen and phosphorus were lower than on the other soils with approximately similar potassium values.
Leaf analysis results of the cocoa are given in Table 7.
TABLE 7. LEAF ANALYSIS RESULTS OF SOME COMMERCIAL COCOA AREAS ON COASTAL CLAY SOILS
| Est. | Soils |
No. of yearsanalysed |
Leaf analysis results (% on d.m.) |
||||
|
N |
P |
K |
Mg |
Ca |
|||
| 1 | Acid Sulphate areas (81% Sedu Series, 1.2% Guar Series) |
4-8 |
2.13-2.25 |
.139-.165 |
1.57-1.83 |
.57-.67 |
.87-1.43 |
| 1 |
Less Acid Sulphate Areas (44% Sedu Series, 27% Selangor Series, 13% Java Series) |
3-9 |
2.05-2.13 |
.146-.154 |
1.50-1.86 |
.57-.83 |
.84-1.03 |
| 2 | Sabrang and Briah Series |
5-6 |
2.00-2.06 |
.146-.158 |
1.37-1.72 |
.82-.90 |
.68-.85 |
| 3 | Bernam/Selangor Series |
2-7 |
1.91-2.06 |
.142-.166 |
1.70-1.74 |
.79-.93 |
.69-.80 |
The feature of the results may be higher N and Ca values in the acid sulphate areas.
• Yields of the coconuts. The coconut yield results in the areas discussed are shown in Table 8 with individual year yield trends in Figure 1.
TABLE 8. COMPARISON OF COCONUT YIELDS (1970-1982) ON ACID SULPHATE AND OTHER COASTAL CLAY SOIL AREAS
| Est. | Soils | Year Planted | Planting Material | Stand/ha |
Copra(kg/ha/yr) |
Copra |
| 1 | Acid Sulphate areas (81% Sedu Series, 1.2% Guar Series) | 1954/55 | Mixed Malayan Dwarfs/hybrids | ~ 244, thinned to ~ 210 in 1979/1980 |
1762 ± 79 |
8.79 ± 0.9 |
| 1 |
Less Acid Sulphate Areas (44% Sedu Series, 27% Selangor Series, 13% Java Series) |
1954/55 | Mixed Malayan Dwarfs/hybrids | ~ 253, thinned to ~ 204 in 1976/1980 |
2095 ± 81 |
8.62 ± .10 |
| 2 | Sabrang and Briah Series | 1954 | Mixed Malayan Dwarfs/hybrids | ~ 270, thinned to ~ 220 in 1978 |
2439 ± 140 |
8.76 ± .46 |
| 3 | Bernam/Selangor Series | 1952 | Malayan Dwarfs | ~ 225 |
1920 ± 145 |
8.42 ± .28 |
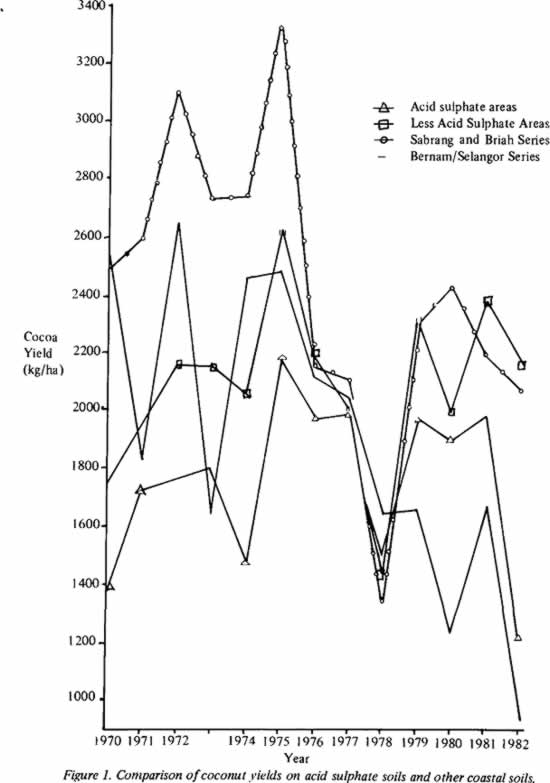
In the Malayan dwarf/hybrid areas, there is a gradation of yield increase from the acid sulphate areas to the non-acid sulphate Sabrang and Briah series areas. Yield over the period considered (approximately year 16 to 28) was 38 per cent higher in the non-acid sulphate area. This would be larger probably but for the thinning carried out in 1978 which reduced differences considerably.
The mean yields in the Malayan Dwarf area on the Bernam/Selangor series area appeared comparable to the acid sulphate areas only. However, this may be misleading as unusually poor results (possibly related to abnormally very high rainfall on the estate) were obtained in the last four years despite no thinning carried out.
Copra content figures do not appear to show differences between the different soil areas. However, again this may be misleading due to differences between the years and possibly estate recording methods (Table 9). Copra content is probably better in non-acid sulphate areas.
| Estate | Soil Series |
Copra content (nuts/kg) |
|||||
| 1971 | 1972 | 1973 | 1980 | 1981 | 1982 | ||
| 1 | Acid Sulphate | 8.75 ± .35 | 8.76 ± .29 | 8.93 ± .14 | 8.96 ± .16 | 8.26 ± ..05 | 8.76 ± .14 |
| 1 | Less Acid Sulphate | 8.54 ± .61 | 8.59 ± .30 | 8.76 ± .35 | 8.99 ± .18 | 8.25 ± .11 | 8.80 ± .11 |
| 2 | Sabrang and Briah Series | 7.24 ± .36 | 7.68 ± .13 | 7.87 ± .22 | 7.84 ± 1.26 | 9.85 ± .325 | 12.17 ± .58 |
| 3 | Bernam/Selangor Series | 7.46 ± .24 | 7.73 ± .43 | 7.91 ± .19 | 8.62 ± .27 | 9.45 ± .24 | 11.22 ± .75 |
• Yields of the cocoa. The cocoa were under planted in the coconut areas in several blocks in each coconut field in the acid sulphate areas due to uncertainty of policy and success over 1968-1975. In the other estates, underplanting of cocoa was carried out in 1968 (Bernam/Selangor area) and in 1969/71 in the Sabrang and Briah soil areas. Planting materials were mainly F1 hybrids.
Yields for some of the oldest plantings have been extracted and yield trends with age for these plantings on the different soils are indicated inFigure 2.
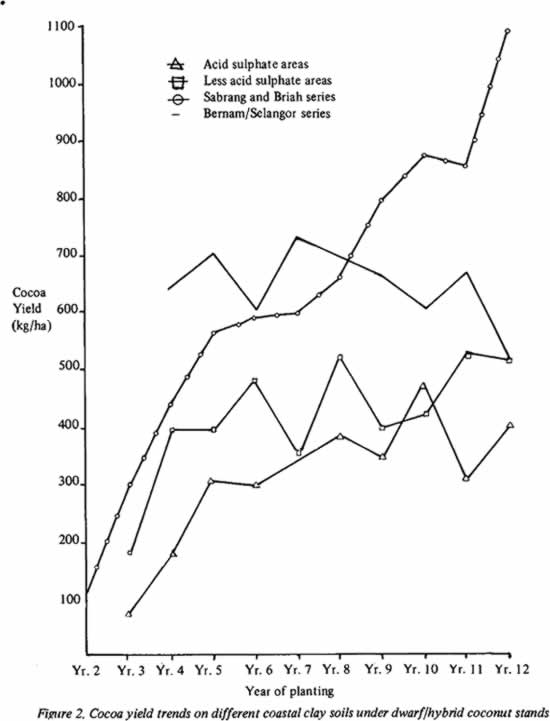
In view of the different planting practices and times, yields up to year five are probably not useful for strict comparison although they indicate that early yield results are also related to acidity of the areas. Yields after year five are shown in Table 10.
TABLE 10. YIELDS FROM COMMERCIAL MATURE COCOA (YR. 6 TO YR. 12) UNDER DWARF/HYBRID COCONUTS ON COASTAL CLAY SOILS
| Estate | Soil series | Coconut shade |
Mean cocoa yieldKg/ha/yr |
Range |
| 1 | Acid Sulphate soils (81% Sedu Series, 12% Guar Series) | Dwarfs/hybrids |
365 ± 56 |
30-40 |
| 1 | Less Acid Sulphate soils (44% Sedu Series, 27% Selangor Series, 13% Java Series) | Dwarfs/hybrids |
460 ± 64 |
30-40 |
| 2 | Sabrang and Briah Series | Dwarfs/hybrids |
732 ± 117 |
30-85 |
| 3 | Bernam/Selangor Series | Dwarfs |
664 ± 47 |
41-43 |
The highest yields were obtained on the Sabrang and Briah series areas under Dwarf/hybrid coconuts. This area outyielded the acid sulphate areas by 59 per cent and 100 per cent. The less acid sulphate areas outyielded the acid sulphate area by 26 per cent. The cocoa in the Bernam/Selangor series outyielded the acid sulphate areas by 44 per cent and 82 per cent.
Absolute yield levels were very low under the generally heavy shade conditions in the acid sulphate areas and even in the non-acid sulphate areas. Improved yield responses seen in Figure 2 in the Sabrang and Briah series area is in part due to reduced shade levels from palm thinning carried out in 1978.
Reference
Chew P.S., Kee K.K. and Ooi L.H. 1984. Management of coconuts and cocoa on acid sulphate soils. The Planter. Incorporated Society of Planters, Kuala Lumpur 60 (704) : 483-498.
Note: The full list of references quoted in this article is available from the above paper.